
Where’s the beef?
In our last blog entry, we discussed a classic RNAi screening paper from 2005 that showed that the top 3 screening hits were were due to off-target effects.
In this post, we analyse a more recent genome-wide RNAi screen by Hasson et al., looking in more detail at what proportion of top screening hits are due to on- vs. off-target effects.
Hasson et al. used the Silencer Select library, a second-generation siRNA library designed to optimise on-target knock down, and chemically modified to reduce off-target effects. Each gene is covered by 3 different siRNAs.
To begin the analysis, we ranked the screened siRNAs in descending order of % Parkin translocation, the study’s main readout.
We then performed a hypergeometric test on all genes covered by the ranked siRNAs. For example, if gene A has three siRNAs that rank 30, 44, and 60, we calculate a p-value for the likelihood of having siRNAs that rank that highly (more details provided at bottom of this post). It’s the underlying principle of the RSA algorithm, widely used in RNAi screening hit selection. If the 3 siRNAs for gene B have a ranking of 25, 1000, and 1500, the p-value will be higher (worse) than for gene A.
The same type of hypergeometric testing was done for the siRNA seeds in the ranked list. For example, if the seed ATCGAA was found in siRNAs having ranks of 11, 300, 4000, and 6000, we would calculate the p-value for those rankings. Seeds are over-represented in siRNAs at the top of the ranked list will have lower p-values.
After doing these hypergeometric tests, we had a gene p-value and a seed p-value for each row in the ranked list. We could then look at each row in the ranked list estimate whether the phenotypic is due to an on- or off-target effect by comparing the gene and seed p-values. [As a cutoff, we said that the effect is due to one of either gene or seed if the difference in p-value is at least two orders of magnitude. If the difference is less than this, the cause was considered ambiguous.]
After assigning the effect as gene/seed/ambiguous, we then calculated the cumulative percent of hits by effect at each position in the ranked list. Those fractions were then plotted as a stacked area chart (here, looking at the top 200 siRNAs from the screen):
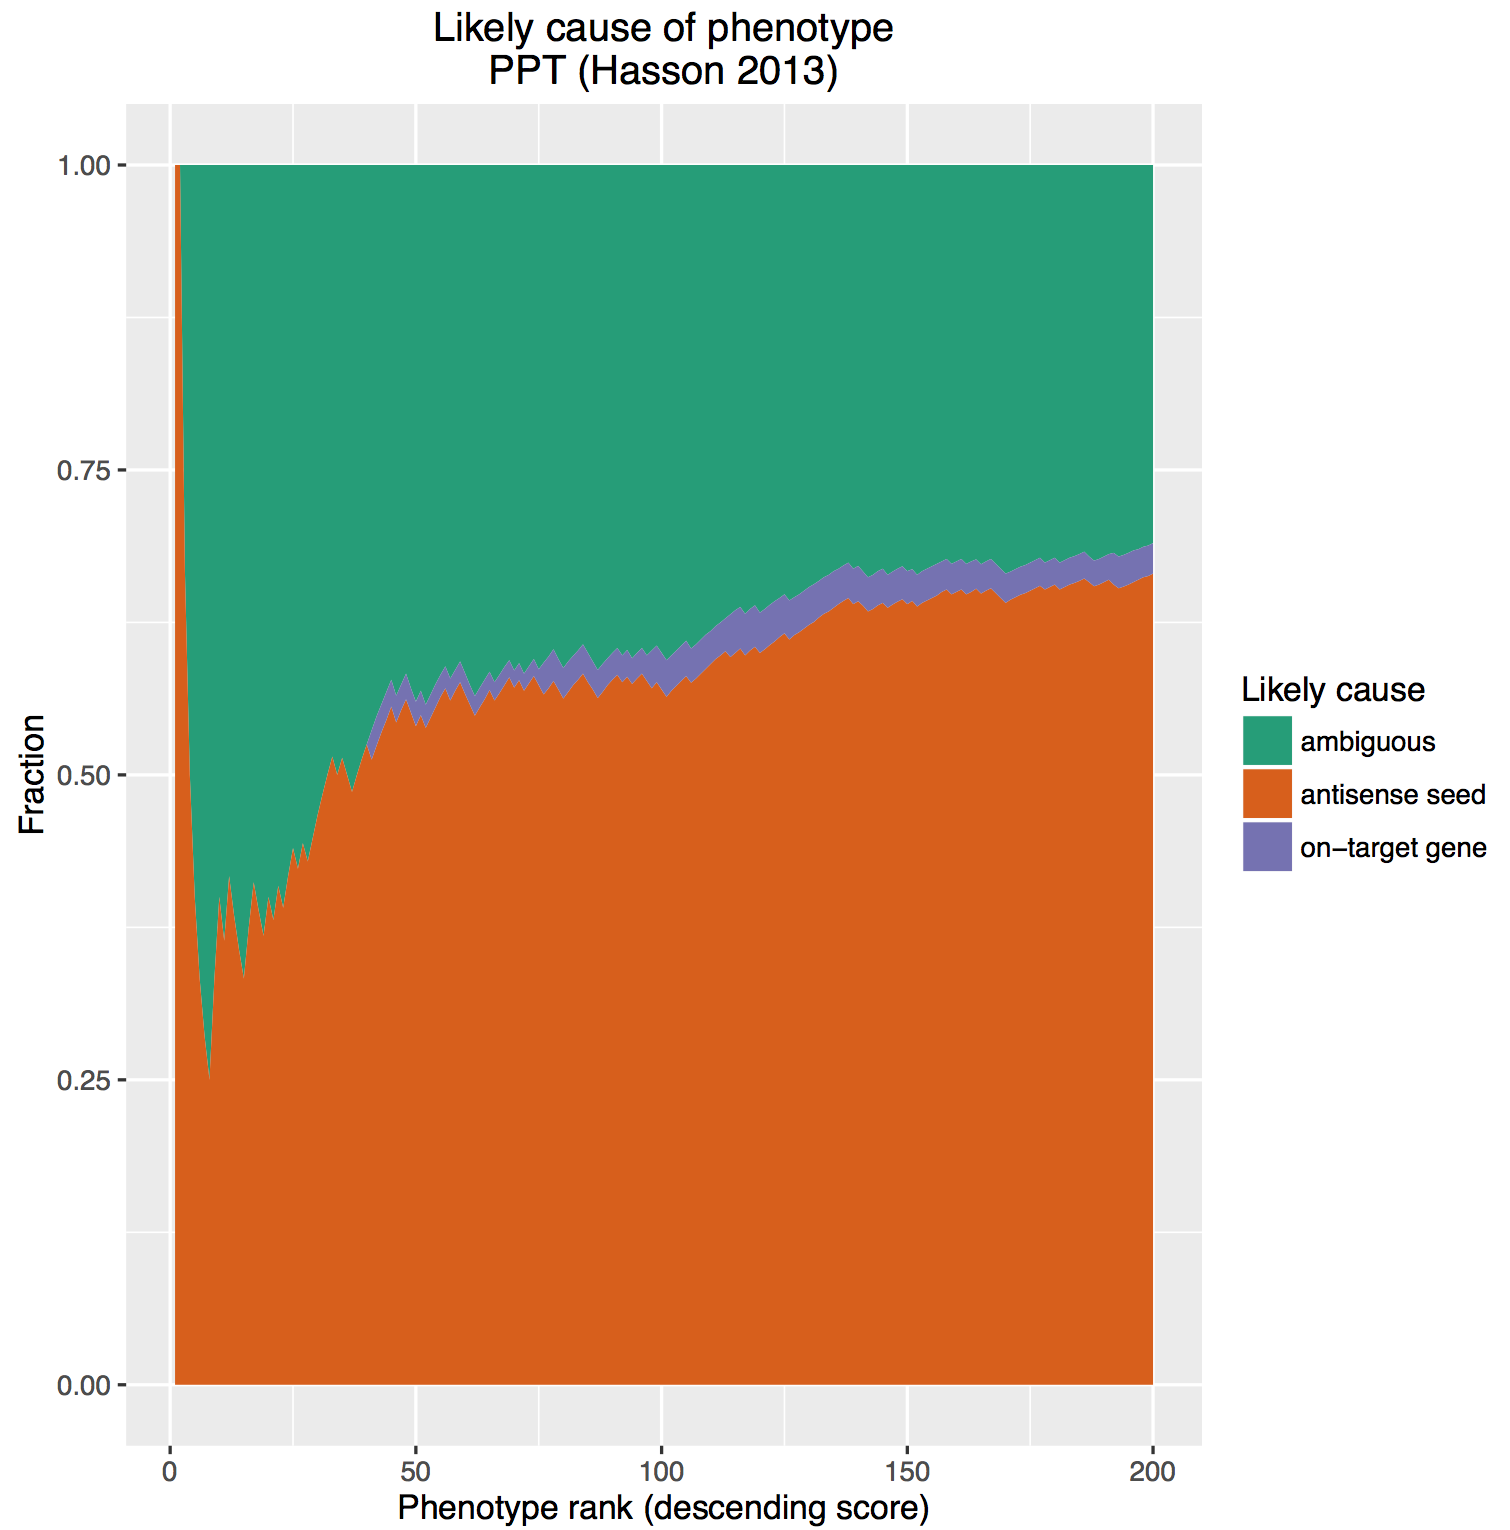
The on-target effect is sandwiched between the massive ‘bun’ of off-target effects and ambiguous cause. We are reminded of these classic commercials from the 80s:
Want to receive regular blog updates? Sign up for our siTOOLs Newsletter:
Note on p-value calculations:
P-values were calculated using the cumulative hyper-geometric test (tests the probability of finding that many or more instances of members belonging to the particular group, in our case a particular gene or seed sequence). The p-value associated with a gene or seed is the best p-value for all the performed tests. For example, assume a gene had siRNAs with the following ranks: 5, 20, 1000. The first test calculates the p-value for finding 1 (of the 3) siRNAs when taking a sample of 5 siRNAs. The next test calculates the p-value for finding 2 (of 3) siRNAs when taking a sample of 20 siRNAs. And the last is the probability of getting 3 (of 3) siRNAs when taking a sample of 1000. If the best p-value came from the second test (2 of 3 siRNAs found in a sample size of 20), that is the p-value that the gene receives. This is also the approach used by the RSA (redundant siRNA activity) algorithm. One advantage of RSA is that it can compensate for variable knock down efficiency of the siRNAs covering a gene (e.g. if 1 of 3 gives little knockdown).

")


One thought on “Where’s the beef?”