Category: General

Novel anti-cancer mechanism identified by shRNA/siRNA off-target effects

Novel anti-cancer mechanism identified by shRNA/siRNA off-target effects

Summary:

siRNA off-target effects takes an interesting turn for cancer research as reported in eLIFE by Putzbach et. al. Research unveiled a specific group of survival genes in cancer cells thanks to the off-target effects of siRNAs/shRNAs.

death receptor signaling pathways
CD95 highlighted in death receptor signaling pathways


CD95 is a death receptor that mediates apoptosis when bound to its ligand, CD95L or FasL. Known for its multiple tumour-promoting activities, it was not surprising that silencing both molecules by RNAi produced cancer cell death.

What was surprising –  death induced by C95/CD95L siRNAs/shRNAs did not work through CD95/CD95L at all. Three observations contributed to this conclusion:

  1. The toxicity correlated with siRNA/shRNA concentration

Using siRNAs at 0.1nM or expressing the shRNA in a miR-30 backbone (developed to reduce off-targets by expressing shRNAs at reduced levels) did not induce the same toxicity


  1. Removing the target did not affect siRNA/shRNA-induced toxicity

Excising the siRNA/shRNA binding sites on CD95/CD95L with CRISPR did not protect cells from toxicity induced by these siRNAs/shRNAs


  1. Restoring expression of the target did not rescue cells from siRNA/shRNA-induced toxicity

Introducing recombinant CD95/CD95L proteins or expressing siRNA-resistant versions of CD95/95L, did not rescue cells from toxicity induced by their siRNA/shRNAs


The case of shRNA/siRNA off-target effects

The evidence was pretty convincing that the toxic effects of the CD95/CD95L siRNA/shRNAs stemmed from off-target effects.

1. Step-wise mutations showed toxicity derived from the seed sequence 

siRNA sequence step-wise mutation shows siRNA off-target effects
siRNA sequence step-wise mutation

Substituting each base of the tox-inducing siRNA (siL3) with the non-toxic siRNA (siScr) sequence in a step-wise cumulative manner either from the seed end or the non-seed end, highlighted toxicity derived from the seed sequence. The seed sequence is a 6-base sequence at position 2 to 7 of the guide RNA strand and is responsible for defining the off-target profile of an siRNA (read this technote for more information)

2. Off-target survival genes identified by RNA-seq

An RNA-seq analysis of CD95 or CD95L shRNA-treated cells identified twelve genes with significantly altered expression levels – 11 downregulated, 1 upregulated:

Death induced by survival gene elimination identified by siRNA off-target effects
Genes regulated by toxic shRNA were important survival genes


It turns out that many of the downregulated genes were important for survival. Additionally, two recent genome-wide lethality screens independently identified six of these genes (highlighted in red). The authors therefore termed this form of CD95/CD95L siRNA/shRNA-induced cell death Death Induced by Survival Gene Elimination (DISE). Don’t we all love acronyms! As depicted, these genes mostly interfered with apoptosis, cell cycle, autophagy and senescence.

3. Survival genes targeted by miRNA-like activity of CD95/CD95L siRNA/shRNAs

Sylamer plots and seed matches to survival genes showing siRNA off-target effects
Survival genes were enriched for seed matches at the 3′ UTR to toxic shRNA

The seed sequence is what microRNAs (miRNAs) use to recognize and downregulate target genes. siRNAs/shRNAs can behave like miRNAs, contributing to the off-target activity. As shown by Sylamer plots, the seed sequence of toxic shRNAs (shL3 and shR6) were enriched in highly downregulated genes. The identified survival genes also contained multiple seed matches over their 3’ UTRs. That leaves little doubt that the CD95/CD95L shRNAs were hitting these genes through miRNA-like off-target activity.

Conclusion:

Once again, we see how siRNA off-target effects can impact experimental results. Though in this case, it actually helped identify relevant survival genes! Notably, siRNA off-target effects likely influence cell viability/proliferation data to a greater extent than other readouts since it is regulated by so many genes.

This is not an isolated report of siRNA off-targeting in cancer. Targets such as STK33 and MELK, identified with RNAi to be important in cancer progression, failed to show the same effects in experiments performed by different groups or alternative techniques. The controversy continues however as their effects on cancer activity continue to be reported.

How to avoid siRNA off-target effects

siPOOLs were developed to avoid siRNA off-target effects through high complexity pooling and optimized design. Phenotypes are therefore more clearly and reliably ascribed to loss-of-function of the target gene. The new siPOOL Cancer Toolbox now provides cancer researchers the ability to disrupt multiple genes reliably, with reduced risk of siRNA off-targets, in an affordable toolkit solution.

siTOOL top 100 cancer gene list for siPOOL Cancer Toolbox

We scoured the published literature for the most highly cited genes involved in multiple forms of cancer. Choose your target genes from our list of top 100 cancer-associated genes to build your own siPOOL Cancer Toolbox.  Notably, CD95, MELK and STK33 did not make the cut!

See our top 100 cancer gene list

Little correlation between Dharmacon siGENOME and ON-TARGETplus reagents

Little correlation between Dharmacon siGENOME and ON-TARGETplus reagents

The most common way to validate hits from Dharmacon siGENOME screens is to test the individual siRNAs from candidate pool hits (siGENOME reagents are low-complexity pools of 4 siRNAs).  In this deconvolution round, we normally see that the individual siRNAs for genes behave very differently and seed effects dominate (discussed here and here).

One could argue that deconvolution is not the correct way to validate candidate hits (even though it’s the method recommended by Dharmacon),  as testing the siRNAs individually will result in seed effects that are suppressed when the siRNAs are pooled.  One problem with this argument is that low-complexity pooling does not get rid of off-target effects (e.g. Fig 5 in this paper), something that is better done via high-complexity pooling.  But assuming it were true, validating with a second Dharmacon pool would be better.

Tejedor et al. (2015) performed a genome-wide Dharmacon siGENOME screen for regulators of Fas/CD95 alternative splicing.  ~1500 genes were identified by a deep-sequencing approach.  ~400 of those were confirmed by high-throughput capillary electrophoresis (HTCE, LabChip).  They then retested those ~400 genes (again by HTCE) using Dharmacon ON-TARGETplus pools.

The following plot shows the values for the siGENOME and ON-TARGETplus pools for the same genes (i.e. each point corresponds to 1 gene).

What’s measured is the percent of splice variants that include exon 6 following siRNA treatment.  That was compared to the values for a plate negative control (untransfected wells) and converted to a robust Z-score.  This is the main readout from the paper.

The Pearson correlation improves if the strong outlier at -150 for siGENOME is removed (R = 0.25), while the Spearman correlation is unchanged.

We see that a fairly small number of genes are giving reproducibly strong phenotypes (e.g. 13 of 400 have robust Z-scores less than -15 for both siGENOME and ON-TARGETplus reagents).

If we remove those 13 strong hit genes, the correlation approaches zero:

Even if the strong outlier for siGENOME is removed, the correlation is still near zero:

Although using a second Dharmacon pool removes some of the arbitrariness of defining validated hits (e.g. saying that 3 of 4 siRNAs must exceed a Z-score cut-off of X, or 2 of 4 siRNAs must exceed a Z-score cut-off of Y), the end result is similar:  A few strong  genes show reproducible phenotypes, while many of the strongest screening hits show inconsistent results.  The main problem, off-target effects in the main screen, is not fixed.

postscript

Tejedor et al. say that 200 genes were confirmed by ON-TARGETplus validation.  They consider a gene confirmed if the absolute value of the robust Z-score is greater than 2.  The Z-score is calculated using the median for untransfected plate controls.  I suspect that a significant proportion of randomly selected genes would also have passed this cut-off.

In table S3 (which has the ON-TARGETplus validation results), there are actually only 177 genes (including 2 controls) that meet this cutoff.  The supplementary methods state: Genes for which Z was >2 or <-2 were considered as positive, and a total number of 200 genes were finally selected as high confidence hits.

Which suggests that genes outside the cut-off were chosen to bring the number up to 200.

But if we look at the Excel sheet with the ‘200 hit genes’, it has 200 rows, but only 199 genes.  The header was included in the count.

This type of off-by-one error is probably not that uncommon.  In a case like this, it does not matter so much.

One case where it did matter was in the Duke/Potti scandal.  The forensic bioinformatics work of the heroes of the Duke scandal found that, when trying to reproduce the results from published software, one of the input files caused problems because of an off-by-one error created by a column header.  That was one of many difficulties in reproducing the Potti paper’s results which eventually led to its exposure.

Orthogonal design in software and RNAi screening

Orthogonal design in software and RNAi screening

The software engineering classic The Pragmatic Progammer popularised the benefits of orthogonality in software design.  They introduce the concept by describing a decidedly non-orthogonal system:

You’re on a helicopter tour of the Grand Canyon when the pilot, who made the obvious mistake of eating fish for lunch , suddenly groans and faints. Fortunately, he left you hovering 100 feet above the ground. You rationalize that the collective pitch lever [2] controls overall lift, so lowering it slightly will start a gentle descent to the ground. However, when you try it, you discover that life isn’t that simple. The helicopter’s nose drops , and you start to spiral down to the left. Suddenly you discover that you’re flying a system where every control input has secondary effects. Lower the left-hand lever and you need to add compensating backward movement to the right-hand stick and push the right pedal. But then each of these changes affects all of the other controls again. Suddenly you’re juggling an unbelievably complex system, where every change impacts all the other inputs. Your workload is phenomenal: your hands and feet are constantly moving, trying to balance all the interacting forces.

[2] Helicopters have four basic controls. The cyclic is the stick you hold in your right hand. Move it, and the helicopter moves in the corresponding direction. Your left hand holds the collective pitch lever. Pull up on this and you increase the pitch on all the blades, generating lift. At the end of the pitch lever is the throttle . Finally you have two foot pedals, which vary the amount of tail rotor thrust and so help turn the helicopter.

As the authors explain:

The basic idea of orthogonality is that things that are not related conceptually should not be related in the system. Parts of the architecture that really have nothing to do with the other, such as the database and the UI [user interface], should not need to be changed together. A change to one should not cause a change to the other.

This applies to many types of design, not just for computer systems.  The plumber should not have to depend on the electrician to fix a broken pipe.

The principle has also been used in RNAi screening, notably by Perreira et al. who introduce the MORR (Multiple Orthologous RNAi Reagent) method to increase confidence in screening hits.  Comparing the results of siRNAs from different manufacturers  is important, but because they operate by the same mechanism (including the off-target effect), they are not really orthologous.  More orthologous would be the comparison between RNAi and CRISPR experiments, which sometimes show discrepancies that point to interesting biology.

To confirm RNAi screening hits, ‘partial orthogonality’ may be preferable.  If screening hits are due to either on-target or off-target effects, confirmation with RNAi reagents that only have one or the other would be better than using CRISPR, where it is difficult to interpret the reason for discrepancies (e.g. is there no phenotype  because of genetic compensation?).

One could use C911s to create a version of the siRNA that, in theory, maintains off-target effects but eliminates on-target effects.  We have observed, however, that C911s often give substantial knockdown of the original target gene (in some ways, C911s are like very good microRNAs).  To be sure that a positive effect with C911s is not due to partial knockdown, one would also need to test that via qPCR.  C911s can create a lot of work.

Far better would be to confirm screening results with siPOOLs, which provide robust knockdown and minimal off-target effects.

One place RNAi practitioners would hope not to find orthogonality is the relationship between on-target knockdown and phenotypic strength.

Since the early days of RNAi, positive correlation between knockdown and phenotypic strength has been suggested as a means to confirms screening results.  Reagents with a better knockdown should give a stronger phenotype.

To test this, we obtained qPCR data for over 2000 siRNAs (Neumann et al.) and checked the performance of those siRNAs against the designated hit genes from an endocytosis screen (Collinet et al.).

If the siRNAs work as expected, those siRNAs with better knockdown should give stronger phenotypes than those with weaker knockdown.

There were 100 genes from the Collinet hits for which there were 3 siRNAs with qPCR data.

For those 100 siRNAs triplets, we compared the phenotypic ranks with the knockdown ranks.  (We were agnostic about the direction of phenotypic strength, and checked whether knockdown and phenotype were consistent when phenotype scores were ranked in either ascending or descending order).  For example, if siRNAs A, B, and C have phenotypic scores of 100, 90, 70 and knockdown of 15%, 20%, 30% remaining mRNA, we would say that phenotypic strength is consistent with knockdown (and because we were agnostic about phenotypic direction, we would also say it was consistent if siRNAs A, B, and C had scores of 70, 90, 100).

The observed number of cases where knockdown rank was consistent with phenotypic rank was then compared to an empirical null distribution, obtained by first randomising the knockdown data for the siRNA triplets before comparison to phenotypic strength.  This randomisation was performed 300 times.  This provides an estimate of what level of agreement between knockdown and phenotype would be expected by chance.  The standard deviation (SD) from this null distribution was then used to convert the difference between observed and expected counts into SD units.

The Collinet dataset provides data for 40 different features.  The above procedure was carried out for each of the 40 features.

To take one feature (Number vesicles EGF) as an example, we observed 34 cases where knockdown was consistent with phenotypic strength.  By chance, we would expect 33.4 (with a standard deviation of 4.9).  The difference in SD units is (34-33.4)/4.9 = 0.1.

As can be seen in the following box plot, the number of SD units between observed and expected counts of knockdown/phenotype agreement for the 40 features is centered near zero (median is 0.1 SD units):

This suggests that there is very little, if any, enrichment in cases where siRNA knockdown strength is correlated with phenotypic strength.  The orthogonality between knockdown and phenotype, given the poor correlation between siRNAs with the same on-target gene, is unfortunately not unexpected.

Understanding Gene Networks with Combinatorial Gene Knockdown

Understanding Gene Networks with Combinatorial Gene Knockdown

Genes hardly ever work alone, functioning instead in complex gene networks.  Increasing advances in genomics and proteomics and corresponding developments in computational analysis, has really put this into perspective. A recent large scale RNAi study by Novartis found this hairball of a gene network in cancer cells:

A gene “hairball”

As such, the standard approach of disrupting the expression of a single gene to study loss-of-function phenotypes may not accurately reveal its genetic function. The highly redundant nature of signalling pathways often allows cells to respond robustly to single-strike manipulations. A combinatorial gene disruption approach, where one disrupts several genes in a single setting, is therefore more effective at elucidating signalling networks.

Types of redundancy

Redundancy can occur across signalling pathways or within a signalling pathway. Paralogous genes arising from gene duplication (B’) may also contribute to redundancy. In the figure above, gene B is disrupted but phenotype remains unaffected if other genes (A or B’) can perform similar functions. Within a single pathway, genetic interactions (A → C) may exist that make B redundant.

In addition to countering redundancy, combinatorial gene disruptions also uncover interesting epistatic or synergistic interactions. An epistatic or synergistic interaction occurs when the effect of disrupting two genes differs from the additive effect expected from disrupting the genes individually. This reveals the nature of genetic interactions and identifies interesting functional networks that play relevant roles in complex diseases. In cancer for example, a combinatorial approach is useful for identifying genes that confer drug resistance and to explore multi-treatment approaches that achieve synthetic lethality of cancer cells.

Combinatorial gene disruption has been successfully applied to yeast where multiple knockouts are easy to generate (Fiedler et al., 2009). However, multiple knockouts are harder to perform in higher organisms and may also not represent the full picture. RNAi, due to its ease of application, has been used for combinatorial disruptions in Drosphila (Nir et al., 2010, Horn et al., 2011), C. Elegans (Tischler et al., 2006) and human cells (Laufer et al., 2013). Its dose-dependency and transient effect also mimics the use of drugs and allows researchers to determine the quantitative nature of functional interactions.

Studies have found that predictions of genetic interactions made based on double gene knockdowns showed greater sensitivity than predictions based on single gene knockdowns. Nir et al analysed cell morphological changes under RNAi knockdown of RhoGAPs in a RhoGTPase overexpression condition. Using single/double knockdowns to validate 5 biologically validated interactions and 3 non-interactions, they found the double knockdowns were far more sensitive in detecting genetic interactions.

Double gene knockdowns (KD) improve sensitivity of genetic interaction detection

Relying on the fact that GAPs deactivate GTPases, a screen using single/double RNAi KDs was performed on RhoGAPs in Drosophila cells. The table above shows validated biological interactions (5 interactions, 3 non-interactions) and prediction success from the single/double KD experiments.

Larger scale studies looking at looking at 50 000 to 70 000 pairwise perturbations of signalling factors in both Drosophila (Horn et al., 2011) and human cells (Laufer et al., 2013) saw similar results. A higher sensitivity was afforded by the double knockdowns and phenotypes obtained from single knockdowns often differed from double knockdowns.

Some challenges highlighted from these large combinatorial RNAi studies:

  • Inconsistent phenotypes from single siRNAs that target the same gene either due to off-target effects or poor knockdown (KD) efficiencies. This is a known problem with siRNAs that siPOOLs were developed to counter. In Laufer et al (2013), an additional quality control step had to be taken to remove inconsistent siRNAs and choose siRNAs that provided good KD.
  • Need for large sample sizes. When Laufer et al. reduced the number of cells analysed from 7100 to 1775, the number of genetic interactions detected decreased from 5262 to 1022 indicating reduced sensitivity. This is naturally assay dependent as well with larger, robust phenotypes requiring smaller sample sizes. A multiparametric (measuring multiple parameters of cell behaviour/morphology) approach is often encouraged to increase data robustness.
  • Differences between model organisms. Knockdown efficiencies in human cells were lower compared to Drosophila cells and off-target effects more widespread. This is a factor for consideration as additional computational analysis and reagent pre-evaluation may be necessary.
  • Greater resources required performing double/triple knockdowns compared to single gene knockdowns. Furthermore, measuring these phenotypes in multiple cell lines are often recommended to affirm phenotypes. Therefore, a focussed approach looking at interesting subsets of genes is recommended.
  • Risk of toxicity increases with increasing concentrations of siRNA used.

The use of siPOOLs counters some of the challenges faced in combinatorial RNAi knockdowns. Due to the low effective working concentration, multiple siPOOLs can be used together with reduced risk of toxicity. The lowered off-target profile and high reproducibility and robustness of on-target knockdown demonstrated with siPOOLs also add to greater data reliability and eliminates the need for siRNA pre-evaluation.

Dr. Derek Welsbie et al. from the University of California, San Diego, recently published in Neuron the use of siPOOLs in a combinatorial knockdown approach. A synergistic relationship between Leucine Zipper Kinase (LZK) and Dual Leucine Zipper Kinase (DLK) was identified to promote survival in an axon degeneration model with primary mouse retinal ganglion cells (RGCs).

A large high-throughput functional genomic screen where cells were first subject to DLK knockdown was performed to sensitize them to other kinase siRNAs that promote RGC survival. In this way LZK was identified and the synergistic relationship was verified with siPOOLs:

LZK and DLK synergize to promote retinal ganglion cell survival

Knockdown of LZK alone produced no visible effect but siPOOL-mediated knockdown of both LZK and DLK produced a synergistic effect on cell survival.

An additional screen was performed where LZK siPOOL was used to sensitize RGCs to protective effects afforded by DLK and potential novel DLK pathway members. Screening performed with 16 698 low complexity pools of 4 siRNAs each, identified 6 novel hits. Though these failed to be verified following siRNA deconvolution (learn why here and here), Haystack analysis to account for seed-based off-targets verified certain hits and additionally identified new hits such as Sox11.

siPOOL-mediated combinatorial knockdown of four identified genes – Sox11, Mef2a, Jun and Atf2 – highly promoted RGC survival under colchicine-induced injury. The survival-promoting synergistic effects of all four transcription factors was comparable to that of the DLK/LZK interaction.

Notably, these effects were verified with CRISPR sgRNA knockouts.

Combinatorial gene disruption allows us to learn more about gene networks and the nature of genetic interactions. Complementing gene knockout approaches, RNAi is an easy method of performing combinatorial gene disruptions in the transient setting.

siPOOLs afford the added advantage of increased efficiency and reliability, removing the need for siRNA pre-evaluation and increasing ease of data analysis.

For more relevant research/siTOOL updates, sign up for our siTOOLs Newsletter:

Loading
“Phenoville” – RNAi & CRISPR Screening Strategies

“Phenoville” – RNAi & CRISPR Screening Strategies

Pleasantville is a movie based on an interesting idea: two teenagers are magically transported through their TV to a town called Pleasantville set in the 1950s where everything is perfect (and also black-and-white).  As they discover the complex, imperfect emotions hidden below the idyllic surface, the black-and-white characters and objects start to gain colour.

In loss-of-function genetic screening, some reagents and screening formats may also give rise to a narrow, black-and-white view of a biological process.  A sort of “Phenoville”.  This was illustrated nicely in a recent review of screening strategies for human-virus interactions by Perreira et al. (2016).

The authors performed screens for human rhinovirus (HRV) infection using arrayed RNAi reagents (siRNAs) and pooled CRISPR reagents (sgRNAs), and then compared the resulting hit lists.

The arrayed RNAi screen produced over 160 high-confidence candidate genes, whereas the CRISPR screen only found 2.  The authors comment:

“The comparison of these two screening approaches side-by-side, using the same cells and virus, raises an interesting point. The number of host factors found for HRV14 was far greater using the MORR/RIGER approach [i.e. RNAi performed with multiple orthologous RNAi reagents and analysed by RNAi gene enrichment ranking method] and is approaching a systems level understanding based on bioinformatic analyses and the near saturation of, or enrichment for, multiple complexes and pathways (Fig. 4) (Perreira et al., 2015). By comparison our matched pooled CRISPR/Cas9 screen for HRV-HFs yielded two high-confidence candidates based on reagent redundancy, ICAM1, the known receptor for HRV14, and EXOC4, a gene involved in exocyst targeting and vesicular transport (He & Guo, 2009). Given the known role of ICAM1 as the host receptor for most HRVs, these results point to entry as the major viral lifecycle stage interrogated by a pooled functional genomic screening approach using a population of randomly biallelic null cells infected by a cytopathic virus.”

In simple terms, RNAi screening produced a richer data set that revealed system level interactions whereas CRISPR screening yielded a small number of specific hits that only affected an early-stage pathway. The ‘systems level understanding’ is nicely shown in the following diagram of the RNAi hits.  The red box at the top left is the only gene (ICAM1) that was common to the RNAi and CRISPR screens.

Perreira et al. conclude that arrayed siRNA screens permit the detection of a larger number of viral dependency factors, albeit with a significant tradeoff in a greater number of false positive hits (mainly due to off-target effects).  In contrast, pooled screens with CRISPR sgRNAs using cell survival as a readout, as also seen with most haploid cell screens, display limited sensitivity but excellent specificity in finding host genes that act early on in viral replication (e.g. ICAM1).

In Perreira et al.‘s words:

“… given the currently available functional genomic strategies if the goal is to find viral entry factors (e.g., host receptors) with high specificity its best to use a pooled survival screen, but alternatively if the aim is to obtain with relative ease a more comprehensive set of host factors, albeit with more prevalent false positives, than an arrayed siRNA screen would be the preferred method.”

Summarizing two options for genetic screeners:

  1. Arrayed RNAi screens
    • provide a richer view of the underlying biology
    • produce more false positives from OTEs
    • produce false negatives from OTEs
  2. Pooled CRISPR screens
    • provide a narrower view of the underlying biology
    • produce fewer false positives
    • produce false negatives because of genetic compensation

Off-target effects (OTEs) are the primary cause of false positives, and the resultant higher assay noise also increases the number of false negatives in arrayed RNAi screens. Reagents like siPOOLs minimize the risk of off-target effects and reduce assay noise.

One key factor not mentioned by Perreira et al. is the presence of genetic compensation in gene knockout approaches.

Putting genetic compensation in terms of human actors, imagine that you are investigating the function of bus drivers in Pleasantville.  To induce loss-of-function, assume that aliens will be abducting the bus drivers.  If the bus drivers are abducted in their sleep (equivalent to a CRISPR knock-out), you may not get a good idea of their function when you film the next day.  People may be compensating by driving, biking or staying home.  Alternatively, the bus company may have found emergency replacement drivers.

Now suppose the bus drivers are abducted in the middle of the day while driving their routes (equivalent to an RNAi knock-down).  The film will show buses crashing (hopefully without any serious injuries, since this is just a TV show!) and the public transportation system will suddenly come to a halt.

RNAi gene knockdown screens with siPOOLs  can provide a significant advantage over CRISPR gene knockout screens in obtaining a system level understanding in biological models.

Want to receive regular blog updates? Sign up for our siTOOLs Newsletter:

Loading
CRISPR/Cas9 Screening – The “Copy-Number Effect”

CRISPR/Cas9 Screening – The “Copy-Number Effect”

Several CRISPR/Cas9 screens identifying essential genes in cancer cell lines have been performed to date (Shalem et al., 2014, Hart et al., 2015, Kiessling et al., 2016). These typically take the form of pooled screens where sgRNA libraries targeting all genes or subsets of genes are introduced in parallel into Cas9-expressing cells, at a single sgRNA per cell. The sgRNAs exert a negative or positive selection pressure on cells based on their impact on cell viability and proliferation. The most depleted or enriched sgRNA sequences are determined by next-generation sequencing, revealing relevant gene ‘hits’. Very similar to how pooled shRNA screens are performed.

From these screens, several groups have observed a worrying phenomenon: CRISPR gRNAs targeting genomic regions of high copy number amplification showed a striking reduction in cell proliferation/survival. Dr William Hahn’s group at the Dana Farber Institute was one of the first to characterize this in a publication last year involving a CRISPR/Cas9 screen on 33 cancer cell lines looking for essential genes. In total, 123411 unique sgRNAs were used targeting 19050 genes (6 sgRNAs/gene), 1864 miRNAs and 1000 non-targeting negative control sgRNAs.

What they discovered is a little worrying to say the least.

The figure shows two genomic regions in two different cell lines (SU86.86 and HT29). At genomic coordinates highlighted by the red box, 3 tracks are shown. Top, copy number from the Cancer Cell Line Encyclopaedia (CCLE) SNP arrays, red indicating above average ploidy and blue showing below; middle, CRISPR/Cas9 guide scores with purple trend line indicating the mean CRISPR guide score for each CN segment defined from the above track; bottom, RNAi gene-dependency scores. AKT2 and MYC, known driver oncogenes at these loci, respectively, are highlighted in orange. For RNAi data, shRNAs targeting AKT2 used in Project Achilles were not effective in suppressing AKT2 (hence the negative result).


Key findings:

  • A striking enrichment of negative CRISPR guide scores (i.e. sgRNAs that reduced cell proliferation/survival) for genes that reside in genomic regions of high copy-number amplification.


  • Genes identified in CRISPR that reduced survival, did not have the same effect when disrupted by RNAi in the same cell lines (this RNAi screen was done by the same group but published 2 years before).


  • This enrichment was seen also for unexpressed genes, i.e. genes not transcribed. Meaning the reduced survival was not due to loss-of-function of the targeted gene.


  • Even for regions with low absolute copy numbers, a significant reduction in survival was observed compared to non-targeting control sgRNAs. Furthermore, the effect was dose-dependent with greater copy number amplifications producing larger negative CRISPR guide scores.

Notably, the correlation between copy number and genes that were scored high on essentiality was also observed when looking at data from other studies (Hart et al., 2015). The “copy number effect” would therefore produce a high number of false positives in CRISPR screens for essential genes in cancer cell lines. The graph above shows just how big an effect this is. Comparing genes identified as essential in a CRISPR screen vs RNAi screen, increasingly essential CRISPR-identified genes were more likely to reside on copy number amplifications (defined as having average sample ploidy > 2). This effect was notably absent for RNAi-derived essential genes.

Aside from false positives, the increased noise due to “copy number effects” also increases false negatives. MET, a gene identified by shRNA screens, for example, failed to be picked out by CRISPR screens as it is located on a chromosome 7 amplicon (7q31) in MKN45 cells (gastric cancer cell line) where all other gRNAs within that amplicon also scored as essential.

The authors go on to explore mechanisms behind the “copy number effect”. They found it was attributed to a DNA damage response stimulated by excessive cutting by Cas9. This response appeared p53-dependent and induced cell cycle arrest at the G2 phase, explaining the anti-proliferative effect. A similar response was seen for promiscuous sgRNAs that cut at multiple sites, with effects being more pronounced when cuts were spread over several chromosomes as opposed to a single chromosome.

How to manage this?

So far, most simply avoid analysing hits where sgRNAs lie at amplified regions or target multiple sites (Wang et al., 2017). However, these regions of copy number amplifications have been implicated in cancer and may contain relevant hits. Several computational methods have therefore recently been developed to correct for “the copy number effect”. Hahn’s group developed a computational algorithm called CERES based on data obtained from CRISPR sgRNA screens in 342 cancer cell lines representing 27 cell lineages.

Novartis also developed a Local Drop Out (LDO) algorithm that corrects obtained data based on examining gRNAs scores at direct genomic neighbours. When multiple neighbouring genes show similar drop out scores, effects are assumed to be due to “copy number effects”. This method has the advantage of not requiring prior knowledge of copy number, however it does require a sufficient density of gRNAs to accurately capture “copy number effects”.  They also had an alternative method, Generalized Additive Model (GAM) where copy number was taken into account.


How the CERES Model Works

The Results – copy number dependency is reduced while preserving essentiality of cancer-specific genes such as KRAS


A step towards the right direction but the penetrance of this effect still raises some concerns:

  • Although false positives are reduced with these computational methods, it is difficult to recapture false negatives. This is dependent on the gRNA having a stronger phenotype compared to neighbouring gRNAs on the amplicon which is not always the case. The LDO method for example still failed to recapture MET.


  • Guide scores can vary with cell line, sgRNA and experimental conditions, making it difficult to apply the same counter-measures to every experiment.


  • Given multiple cut sites trigger the same effect, how do we ensure multiple sgRNAs when introduced into a cell are not inducing a similar response? This is difficult to control in pooled screens, and poses a limitation in multiplex screens. Synthetic lethality screens for example with sgRNAs targeting multiple genes, might be subject to a higher false positive rate.


  • With even diploid genes (copy number = 2) having statistically significant growth reduction compared to haploid gene loci, the challenge still remains to delineate a true loss-of-function over a non-specific cellular response.


  • Negative sgRNA controls have to be carefully selected. From the study, non-targeting controls had little impact on viability compared to most other sgRNAs. Controls targeting non-expressed genes or non-essential loci have been recommended as better controls.


  • Lastly, although this effect seems to apply mostly to cancer cell lines that undergo a high rate of gene amplifications, similar effects may extend to polyploid tissues such as the liver.

Hence as always gene function should be determined by a variety of methods. Using RNAi for example to affirm a CRISPR-knockout phenotype would add greater confidence to a hit. To avoid those RNAi-related false positives however, its probably best to use siPOOLs.


Source of figures:

Aguirre, A. J., Meyers, R. M., Weir, B. A., Vazquez, F., Zhang, C.-Z., Ben-David, U., … Hahn, W. C. (2016). Genomic Copy Number Dictates a Gene-Independent Cell Response to CRISPR/Cas9 Targeting. Cancer Discovery, 6(8), 914 LP-929.

Meyers, R. M., Bryan, J. G., McFarland, J. M., Weir, B. A., Sizemore, A. E., Xu, H., … Tsherniak, A. (2017). Computational correction of copy-number effect improves specificity of CRISPR-Cas9 essentiality screens in cancer cells. bioRxiv. Retrieved from https://biorxiv.org/content/early/2017/07/10/160861.abstract

Other relevant sources:

Munoz, D. M., Cassiani, P. J., Li, L., Billy, E., Korn, J. M., Jones, M. D., … Schlabach, M. R. (2016). CRISPR Screens Provide a Comprehensive Assessment of Cancer Vulnerabilities but Generate False-Positive Hits for Highly Amplified Genomic Regions. Cancer Discovery, 6(8), 900 LP-913. Retrieved from https://cancerdiscovery.aacrjournals.org/content/6/8/900.abstract

de Weck, A., Golji, J., Jones, M. D., Korn, J. M., Billy, E., McDonald, E. R., … Kauffmann, A. (2017). Correction of copy number induced false positives in CRISPR screens. bioRxiv. Retrieved from https://biorxiv.org/content/early/2017/06/23/151985.abstract


Want to receive regular blog updates? Sign up for our siTOOLs Newsletter:

Loading
siRNA vs shRNA – applications and off-targeting

siRNA vs shRNA – applications and off-targeting

Short interfering RNA (siRNA) and short hairpin RNA (shRNA) are both used in RNAi-mediated gene silencing. In this blogpost, we explore the differences in applications of siRNA and shRNA and compare their capacity for off-targeting.

For a summary of their properties, please refer to Table 1 at the end of  the post.

In what situations should we use siRNA or shRNA?

In terms of application, siRNAs are commonly applied for rapid and transient knockdown of gene expression.

It is performed in cell lines amenable to transfection by liposomes/electroporation and effects typically last from 3-7 days though retransfection can be performed to extend the effect.

The amount of siRNA introduced can be highly controlled and efficiency of gene knockdown is dependent on the levels of siRNA in the cell which is influenced by transfection efficiency and siRNA stability. Knockdown is also influenced by characteristics of the gene. A gene that is highly transcribed for example, may experience less siRNA-mediated downregulation compared to a gene where lesser copies of RNA are produced over time. In addition, a gene which expresses a protein with a very long half-life, may require extended periods of siRNA application to see a knockdown effect.

Due to the transient effect of siRNAs, shRNAs were developed to be used for prolonged knockdown of genes.

As they are introduced by viral vectors, cells that are more difficult to transfect are better targeted with shRNA. Furthermore, promoter-driven expression allows for inducible expression of the shRNA. Depending on the viral vector used – refer to Labome’s post that covers siRNA/shRNA delivery in greater detail – the shRNA may be integrated into the host genome, allowing it to be propagated into daughter cells. This maintains a consistent gene knockdown over several generations. However, knockdown efficiency can decline over time. This is mainly due to varying levels of uptake of the shRNA among cells, with a cell population having lower shRNA expression being over-represented with time.

What about RNAi screening?

siRNAs and shRNAs are both used in RNAi screening to identify genes of interest in a studied phenotype. These are performed with siRNA/shRNA libraries that target a large variety of genes. There are two RNAi screening formats commonly used – arrayed and pooled.

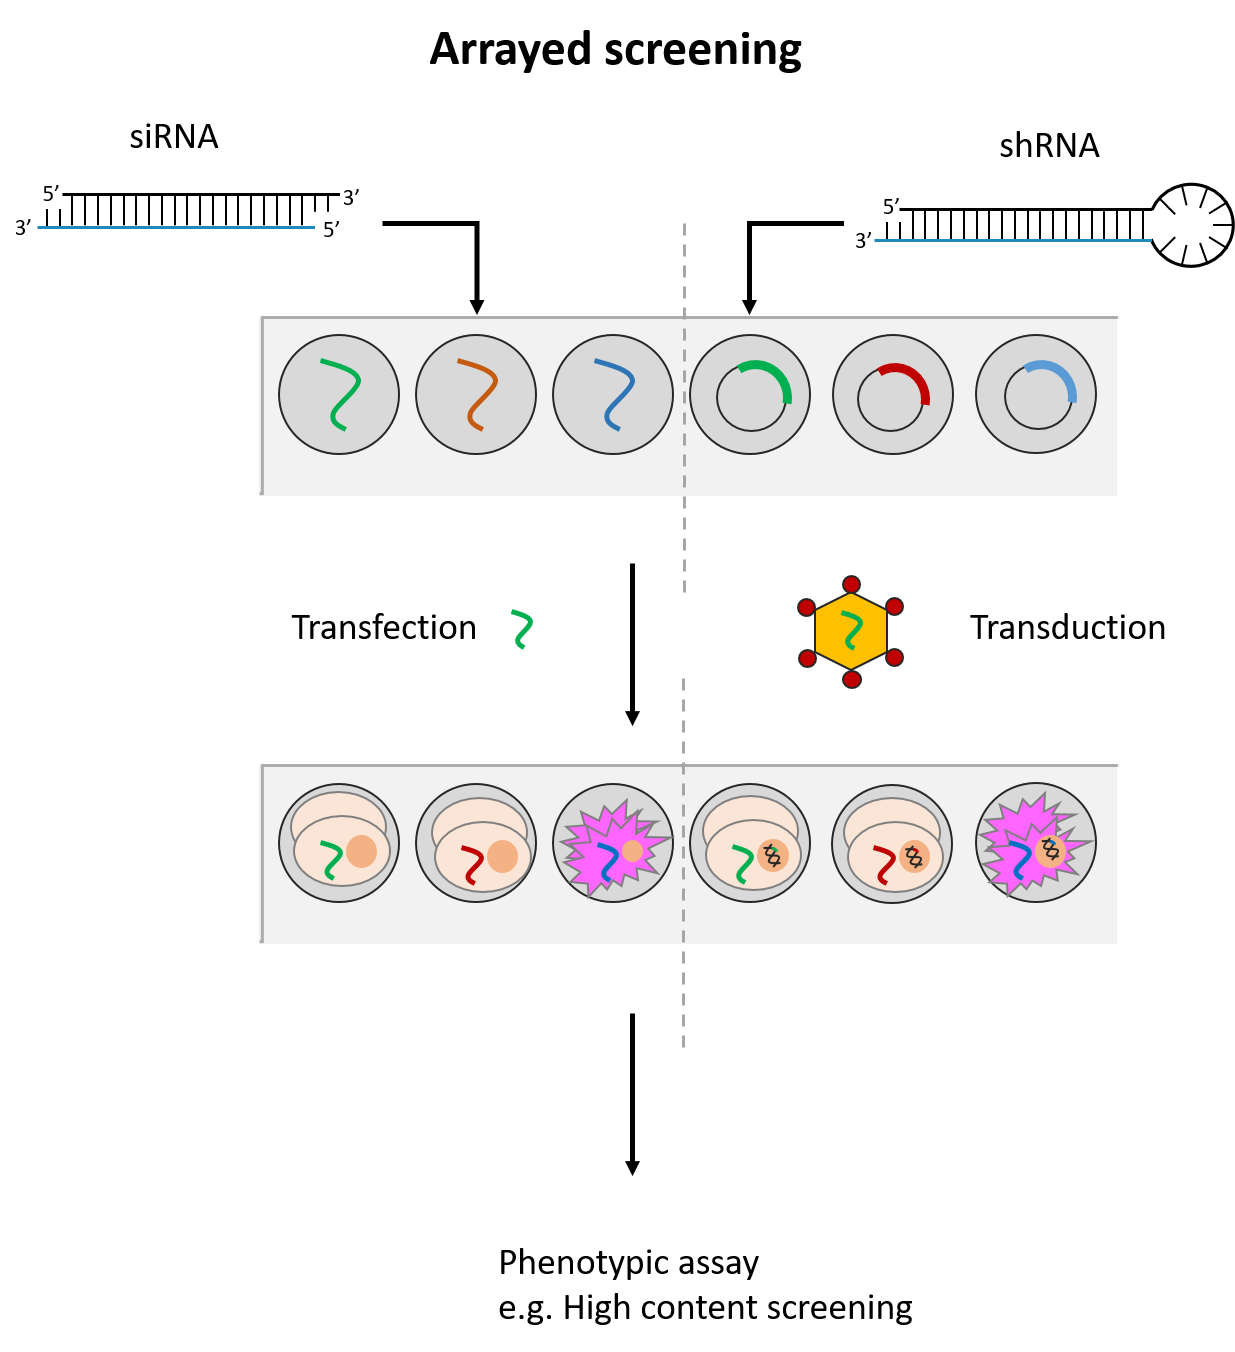
siRNAs and shRNAs can both be used in an arrayed screening format. This means that the siRNA(s)/shRNA(s) against each gene is tested in distinct cell populations. Arrayed screens have the advantage of being compatible with various phenotypic readouts and do not suffer from possible reagent cross-talk or challenges associated with deconvoluting data. However, they are more energy and resource-intensive to perform. (See Fig. 2)

The pooled screening format in contrast, applies only with shRNAs. Here, all shRNAs (e.g. a whole-genome shRNA library) are introduced to a single cell population. As low titers of viral vectors are used, each cell in the population is expected to take up one shRNA vector.

With pooled screening, only readouts linked to cell number can be assessed. These include measurements for cell viability or altered expression of a cell surface marker assessed by fluorescence activated-cell sorting. shRNAs targeting genes which impact these readouts are expected to skew the cell population, such that only cells affected by the relevant shRNAs can be identified. This is either through negative selection, where lost cell populations are noted, or positive selection, where cells with certain shRNAs become over-represented.

The resulting cell population is then assessed by PCR, microarray hybridization or next generation sequencing to measure which shRNAs are highly or lowly-represented. The shRNAs are identified usually by means of a DNA barcode present in the vector sequence. Of note, pooled screens take up less resources to perform but require longer assay times to allow for significant changes in the overall cell population to occur.

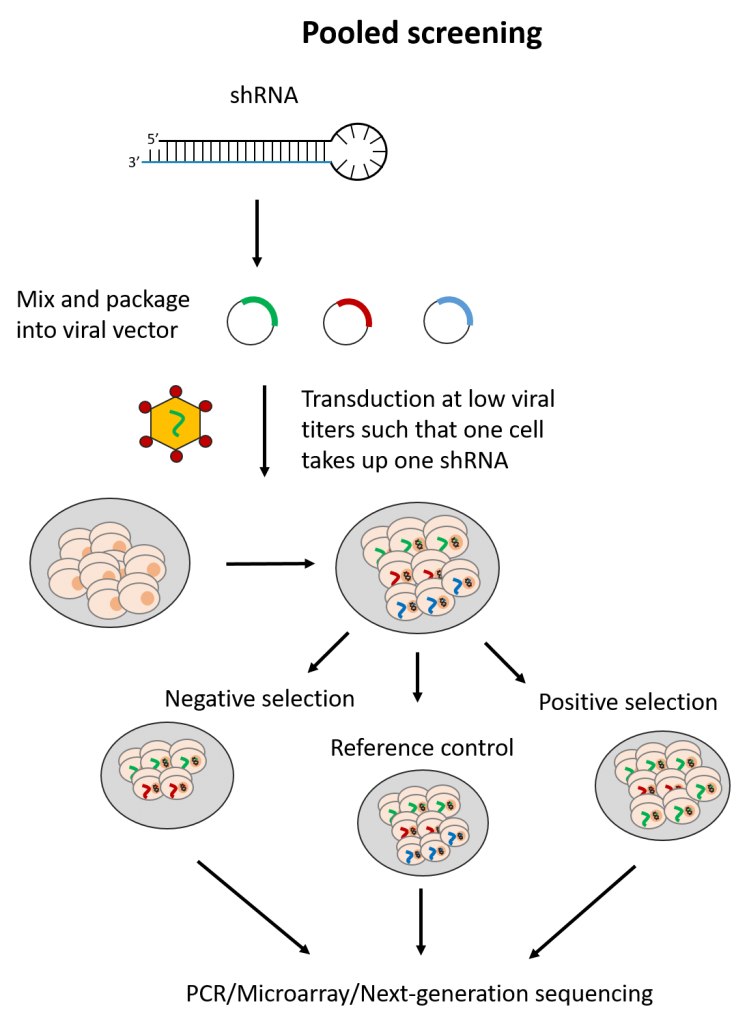
Fig. 2 Simplified workflow for arrayed and pooled RNAi screening formats

Off-target effects with shRNAs?

The use of siRNAs are known to produce several off-target effects but what about shRNAs? Given they are processed the same way as siRNAs, shRNAs are also subject to microRNA-like off-target effects. In addition, because they are expressed from DNA and rely on endogenous machinery to be processed into siRNA, several variations may be introduced not found with introducing siRNA directly. Some potential sources of off-target effects for shRNAs include:

1. Promoter-driven expression. shRNAs are typically controlled with a U6 promoter which drives high levels of transcription via RNA polymerase III. The high shRNA expression levels may saturate endogenous RNAi machinery, contributing to off-target effects. To counter this, shRNAs can be expressed in a context mimicking miRNAs, utilizing RNA polymerase II for transcription instead. This has been found by several groups to reduce the incidence of off-target effects (Grimm et al., 2006, Kampman et al., 2015)

2. Dicer-mediated hairpin processing. shRNAs undergo Dicer-mediated cleavage in the cytosol to remove its hairpin loop. Gu et al., 2012 reported that Dicer cleaves with sufficient heterogeneity to generate multiple sequences. This factor was reported to generate the higher noise levels unique to shRNA screens (Bhinder and Djaballah, 2013). As specificity of Dicer cleavage is influenced by neighbouring loop and bulge structures, care should be taken in shRNA design.

3. Multiple shRNA uptake. During viral transduction, the viral titer is minimized to increase the probability that cells take up a single shRNA vector. However, this does not guarantee that multiple shRNA uptake will not occur. In this event, a combinatorial gene knockdown ensues resulting in a mixed phenotype that may generate false hits.

4. Differences in genomic integration between shRNAs. Varying efficiencies in transfection and genome integration between shRNAs may skew results to over-represent certain shRNAs over others, especially in pooled screens. Furthermore, integration into the host genome may disrupt the function of certain genes, producing more off-targets.

Studies comparing results from siRNA and shRNA screens have found extremely poor overlap, both between and within the reagent-specific screens. Bhinder and Djaballah’s (2013) analysis of results from 30 published RNAi screens (16 siRNA, 14 shRNA) searching for genes that impact cell viability saw no common genes identified across the board. Furthermore, different genes were identified depending on whether the screen used siRNA or shRNA. PLK1 for example, was a prominent hit for siRNA screens but was only marginally represented in shRNA screens. In contrast, KRAS was a top hit among shRNA screens.

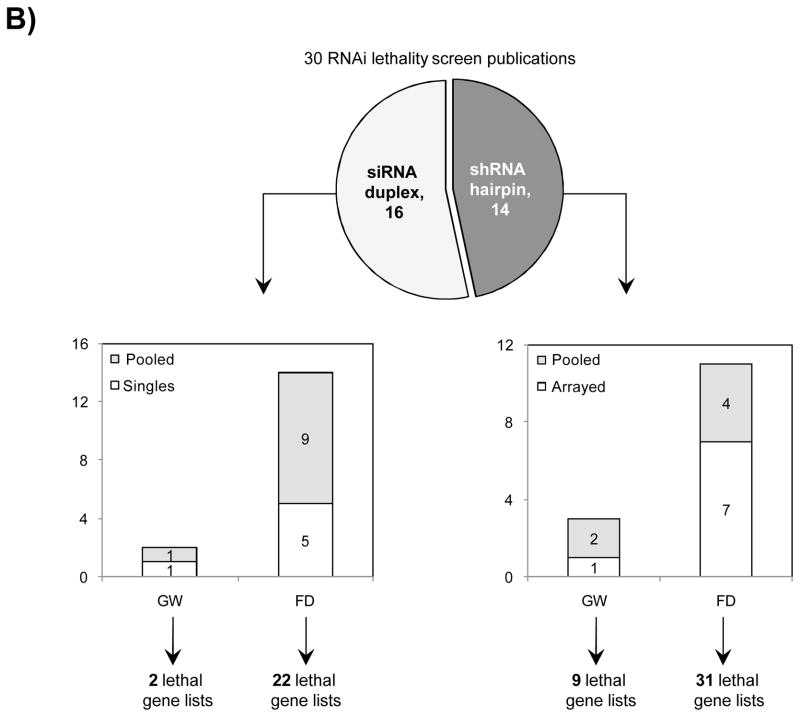
Fig. 3 Reagent format of RNAi screens analysed in Bhinder and Djaballah, 2013 Screens were performed either with genome-wide (GW) or focused (FD) siRNA/shRNA libraries. For siRNA screens, Pooled refers to pools of 3 siRNAs applied together compared to Singles where a single siRNA duplex was applied. For shRNA screens, Pooled refers to a pooled format screen (Fig. 2) where ~50, 000 shRNAs were applied to a single cell population. Arrayed refers to arrayed format screen where shRNAs were applied individually (Fig. 2).

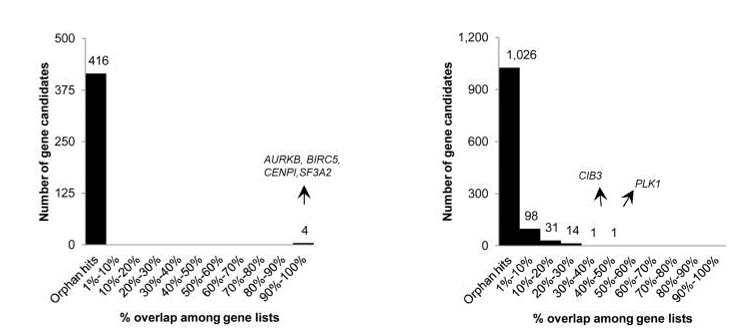
Fig. 4 Overlap of hits among genome-wide (left) and focused (right) siRNA screens (Bhinder and Djaballah, 2013) Only 4 common hits detected across the 2 lethal gene lists from genome-wide siRNA screens. In focused siRNA screens, a greater overlap was detected but still limited across the 22 lethal gene lists. PLK1 detected in 9 out of 22 gene lists.

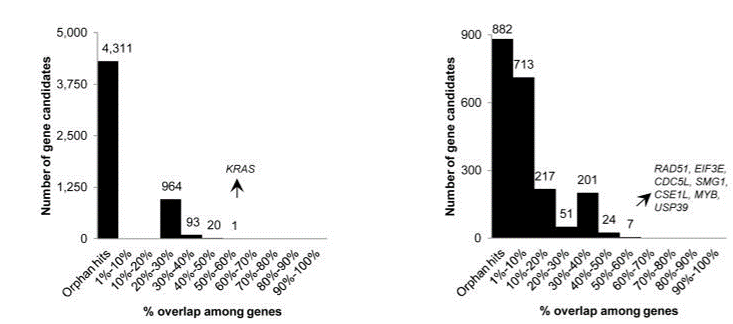
Fig. 5 Overlap of hits among genome-wide (left) and focused (right) shRNA screens (Bhinder and Djaballah, 2013) KRAS was a top hit in shRNA GW screens, appearing in 5 out of 9 lists. In focused shRNA screens, KRAS was present in 15 out of 31 lists. 

Worryingly, an enrichment of gene candidates exclusive to pooled shRNA screens was observed as opposed to arrayed shRNA or siRNA screens. Most of the overlap seen in gene lists (80% global overlaps, 60% after stringent filtering) were specific to pooled shRNA screens. Exclusion of data from pooled shRNA screens would have reduced overlap to a mere 27%. This indicates gene targets obtained from shRNA pooled screens is specific to the technique as opposed to specific gene downregulation.

Furthermore, a greater number of hits were obtained from shRNA screens – 6664 candidates from 40 shRNA gene lists – as opposed to 1525 candidates from 24 siRNA gene lists. This indicates a generally noisier dataset associated with shRNA screens.

Bhinder and Djaballah later performed a head-to-head comparison of an arrayed siRNA and shRNA screen and reported similarly dismal results. Despite using a gain-of-function assay, which tends to yield clearer results, only a 29 hit overlap was seen between siRNA and shRNA libraries which shared 15,068 common genes. Based on a known set of positive controls, siRNAs identified 8 known regulators as opposed to shRNA which only identified 3. Furthermore, predicted siRNA sequences obtained after Dicer-processing of shRNA which corresponded to exactly the same siRNA sequence from the siRNA library yielded different phenotypes. The authors highlight that differential intracellular processing of the shRNA contributes significantly to the discrepancies observed.

It is evident that shRNAs are at risk to greater number of off-target effects than siRNAs. Much care should be taken towards the interpretation of pooled shRNA screens in particular. Secondary validation of gene hits plays an increasingly important role. It is recommended to validate gene hits with siPOOLs (high-complexity, defined siRNA pools) which have a lower off-target profile than single siRNAs or low complexity siRNA pools of 3-4. siPOOL-resistant rescue constructs enable further affirmation that the loss-of-function phenotype is attributed to the target gene. Alternative tools such as compounds, antibodies or gene knockout technologies are also highly recommended.

Want to receive regular blog updates? Sign up for our siTOOLs Newsletter:

Loading

Table. 1 Comparison of properties between siRNA and shRNA

siRNA shRNA
Structure 20-25 nucleotide long double-stranded RNA (dsRNA) with 2 nucleotide overhangs at the 3’ end

~57-58 nucleotide long RNA sequence with a dsRNA region linked by non-pairing nucleotides to form a stem-loop structure

Delivery RNA itself with liposome/electroporation-mediated delivery into cells Usually delivered to cells via viral vectors. DNA may be incorporated into host genome depending on viral vector used.
Processing In the cytosol, guide or antisense strand* (shown in blue in Fig. 1) is incorporated into RNA induced silencing complex (RISC). RISC is guided towards RNA transcripts with the complementary sequence to mediate cleavage and subsequent degradation of the transcript.

*Note that the sense strand may also load into RISC and mediate off-targeting but incidence of this is reduced by designing siRNA with  appropriate thermodynamic properties (refer to previous blogpost on siRNA design)

In the nucleus, shRNA is transcribed from DNA by either RNA polymerase I or III, depending on the promoter.

Drosha, a member of the ribonuclease III family, processes the RNA transcript of its long flanking single-stranded RNA sequences and the resultant shRNA is exported out of the nucleus by Exportin-5.

In the cytosol, the enzyme Dicer cuts off the hairpin loop of the shRNA and releases the functional active siRNA which follows the same downstream processing as siRNAs.

Length of expression Varies from 3-7 days. Affected by degradation of siRNA within cell and dilution of effect upon cell division. Expression can be reinstated by re-transfecting the siRNA. If the DNA is stably integrated in the host genome, knock-down is theoretically permanent.
Control of knockdown Easily controlled by varying amount of siRNA introduced. Magnitude of knockdown harder to control as determined by promoter-driven efficiency and shRNA vector uptake. Expression however can be made inducible with Tet-on/off systems.
Unexpected Mutations after CRISPR in vivo editing – post-commentary

Unexpected Mutations after CRISPR in vivo editing – post-commentary

You might have heard or participated in the global discussion over the recently published Nature Commentary that described >1000 off-target mutations in CRISPR-edited mice.

The paper reported a small study involving three mice but gained enough virality online to trigger a significant drop in share prices of companies founded based on CRISPR gene-editing – Editas Medicine, CRISPR Therapeutics and Intellia Therapeutics.

Here is a summary of the study, with respective concerns raised by the scientific community regarding the validity of the findings. These are highlighted *in blue with further explanations below:

  • FVB/NJ mice were used in the study.These mice are a highly inbred strain (F87 on Dec 2002) originating from the NIH but transferred to The Jackson Laboratory for maintenance and sale. They are homozygous for the Pde6brd1 allele, subjecting them to early onset retinal degeneration.


  • The same authors previously published a pretty decent paper where they functionally characterized a rescue of the retinal degeneration by correcting what was thought to be a nonsense mutation (Y347X, C>A) at exon7 of the Pde6β subunit. The same “rescued” mice, edited by CRISPR (F03 and F05), along with the control co-housed mouse that did not undergo editing, were used in this subsequent sequencing study. *Concern 1


  • The CRISPR mutation was performed by introducing the sgRNA via a pX335 plasmid (which would co-express Cas9D10A nickase) into FVB/NJ zygotes, alongside a single-stranded oligo which acts as a donor to introduce a controlled mutation at the Pde6b. WT Cas9 protein was also introduced. *Concern 2


  • DNA was isolated from spleen of the mice and whole genome sequencing was performed with an Illumina HiSeq 2500 sequencer with a 50X coverage for CRISPR-treated mice and 30X coverage for the control mouse.


  • The authors used three different algorithms to detect variants – Mutect, Lofreq and Strelka. The number of single nucleotide variants (SNVs) and insertion deletions (indels) detected that were absent in the control mouse are shown below for the two CRISPR-edited mice.


Overlap of SNV/indels detected in two CRISPR-edited mice – F03 mouse (blue), F05 mouse (green).


  • Each of the variants were filtered against the FVB/NJ genome in the mouse dbSNP database (v138) and also against 36 other mouse strains from the Mouse Genome Project (v3). As none of the variants detected were found in these database genomes, the authors concluded they had to arise through CRISPR-editing. *Concern 3


  • Interestingly, the top 50 predicted off-target sites showed no mutations. And in sites where mutations were detected, there was no significant sequence homology against the sgRNA used. The authors conclude in silico modelling fails to predict off-target sites. *Concern 4.

A number of criticisms have been raised regarding the study and the four main concerns highlighted are explained below:

Concern 1: The study only involved three mice, hence is too underpowered to draw any statistically significant conclusions. Further, the choice of control mouse simply being a co-housed mouse (no mention of its background) may fail to capture any genetic alterations induced by the experimental procedure or by genetic drift within a colony.

More appropriate controls may have included a mouse produced with a sham-injected zygote, a mouse where only Cas9 was introduced without an sgRNA, and a mouse with only sgRNA and ssDNA donor.

Parent mice should also have been sequenced to check if variants detected were already in the existing strain.

Concern 2: Cas9 was introduced both as a protein and in a plasmid. Talk about overkill! Though the plasmid form of Cas9 is the nickase version, where 2 sgRNAs are required to produce a double-strand break, having high levels of active Cas9 floating about has been demonstrated to increase the incidence of off-target effects.

Concern 3: Even though the authors filtered the variants found against mouse genome databases, this may not be sufficient to capture the extent of genetic drift that occurs over multiple generations of in-breeding.

Gaetan Burgio wrote that from his experience, the reference genomes found in databases often fail to capture the amount of variants that are specific to every breeding facility. Often large numbers of reference mice (1oo mouse exomes from > 50 founders) have to be sequenced to determine if SNPs were specific to the mouse strain and not induced by the test condition.

Editas and George Church’s group from Harvard also highlighted the high amount of overlap in SNVs/indels between the two CRISPR-edited mice which..

“strongly suggests the vast majority of these mutations were present in the animals of origin. The odds of  the exact nucleotide changes occurring in the exact same position of the exact same gene at the exact same ratios in almost every case are effectively zero.”

Concern 4: Apart from the flaw that only one sgRNA was studied, Church’s group also claim the sgRNA studied had a high off-target profile. This sgRNA would apparently have failed their criteria for use as a therapeutic candidate. The table below shows the number of predicted off-target sites when allowing for 1-3 mismatches from the sgRNA sequence.

Predicted off-target profile of sgRNA used in study
Off-target sites with 1 mismatch 1
Off-target sites with 2 mismatches 1
Off-target sites with 3 mismatches 24


What was surprising from the study however, was that despite the high off-targeting potential, mutations were not seen at predicted off-target sites.

The consensus therefore, by both Church’s group and the authors of the study was that one cannot rely on in silico prediction alone to account for off-target effects.

Calls are now being made to validate the study using the appropriate controls, or to compare the variants obtained with other more updated mouse genome SNP databases. I expect we will not hear the last of this study.

The study however, does re-enforce our message in a previous blogpost of validating CRISPR experiments with other techniques to establish gene function. It also highlights the extensive genetic heterogeneity seen now not only between cell lines, but between mouse strains. As always we recommend not being swept up in the hype, but to remain scientifically skeptical.

Want to receive regular blog updates? Sign up for our siTOOLs Newsletter:

Loading
Making sense of siGENOME deconvolution

Making sense of siGENOME deconvolution

As discussed previously, deconvoluted Dharmacon siGENOME pools often give surprising results.  (Deconvolution is the process of testing the 4 siRNAs in a pool individually.  This is usually done in the validation phase of siRNA screens.)

One way to compare the relative contribution of target gene and off-target effects is to calculate the correlation between reagents having the same target gene or the same seed sequence.  One of the first things we do when analysing single siRNA screens is to calculate a robust form of the intraclass correlation (rICC, see discussion at bottom for more about this).

Recently we were analysing deconvolution data from Adamson et al. (2012) and calculated the following rICC’s.  (The phenotype measured was relative homologous recombination.)

Grouping variable  rICC    95% confidence interval

Target gene        0.040   -0.021-0.099
Antisense 7mer     0.383   0.357-0.413
Sense 7mer         0.093   0.054-0.129

Besides the order of magnitude difference between target gene and antisense seed correlation (which is commonly observed in RNAi screens), what stands out is the ~2-fold difference between the correlation by target gene and sense seed.

Very little of the the sense strand should be loaded into RISC, if the siRNAs were designed with appropriate thermodynamic considerations (the 5′ antisense end should be less stable than the 5′ sense end, to ensure that the antisense strand is preferentially loaded into RISC).

The above correlations suggest that some not insubstantial amount of sense strand is making it into the RISC complex.

Here is the distribution of delta-delta-G for siPOOLs and siGENOME siRNAs targeting the same 500 human kinases (see bottom of post for discussion of calculation).  A positive delta-delta G means that the sense end is more thermodynamically stable than the antisense end, favouring the loading of the antisense strand into RISC.

This discrepancy in delta-delta G is also consistent with comparison of mRNA knockdown:

The siGENOME knockdown data comes from 774 genes analysed by qPCR in Simpson et al. (2008).  The siPOOL knockdown data is from 223 genes where we have done qPCR validation.

Of note, the siGENOME pools were tested at 100 nM, whereas siPOOLs were tested at 1 nM.

(It should be mentioned that, although consistent with the observed differences in ddG, this is only an indirect comparison, and delta-delta G is not the only determinant of functional siRNAs.)

Notes on intraclass correlation

Intraclass correlation measures the agreement between multiple measurements (in this case, multiple siRNAs with the same target gene, or multiple siRNAs with the same seed sequence).   One could also pair off all the repeated measures and calculate correlation using standard methods (parametrically using Pearson’s method, or non-parametrically using Spearman’s method).  The main problem with such an approach is that there is no natural way to determine which measure goes in the x or y column.  Correlations are normally between different variables (e.g. height and weight).  In a case of repeated measures, there is no natural order, so the intraclass correlation (ICC) is the more correct way to measure the similarity of within-group measurements.  As ICC depends on a normal distribution, datasets must first be examined, and if necessary, transformed beforehand.

Robust methods have the advantage of permitting the use of untransformed data, which is especially useful when running scripts across hundreds of screening dataset features.  The algorithm we use calculates a robust approximation of the ICC by combining resampling and non-parametric correlation.

Here is the algorithm, in a nutshell:

  1. Group observations (e.g. cell count) by the grouping variable (e.g. target gene or antisense seed)
  2. Randomly assign one value of each group to the x or y column (groups with one 1 observation are skipped)
    • for example, if the grouping variable is target gene and siRNAs targeting PLK1 had the values 23, 30, 37, 45, the program would randomly choose 1 of the values for the x column and another for the y column
  3. Calcule Spearman’s rho (non-parametric measure of correlation)
  4. Repeat steps 1-3 a set number of times (e.g. 300) and store the calculated rho’s
  5. Calculate mean of the rho values from 4.  This is the robust approximation of the ICC (rICC).
    • Values from 4 are also used to calculate confidence intervals.

The program that calculates this is available upon request.

Notes on calculating delta-delta G

Delta-delta G was calculated using the Vienna RNA package, as detailed here: https://www.biostars.org/p/58979/ (in answer by Brad Chapman).

The delta-delta G was calculated using 3 terminal bps.  We found that that ddG of the terminal 3 bps had the strongest correlation with observed knockdown.  Others (e.g. Schwarz et al., 2003 and Khvorova et al., 2003) have also used the terminal 4 bps.

Want to receive regular blog updates? Sign up for our siTOOLs Newsletter:

Loading
How reproducible are CRISPR screens?

How reproducible are CRISPR screens?

The reproducibility of different CRISPR or RNAi reagents targeting the same gene is sometimes cited as prima facie evidence for the superiority of CRISPR screens to RNAi screens.

A landmark paper by Shalem et al. showed that different gRNAs inhibit gene expression much more consistently than do different shRNAs:

But does this ensure that CRISPR screens are more reliable (as determined by assay reproducibility) than RNAi screens?  Not necessarily.

Shalem et al. performed two pooled CRISPR screens in parallel, and found substantial overlap between the top hits.

How does this overlap compare to that between replicate RNAi screens?

In 2010, Barrows et al. tested the reproducibility between genome-wide siRNA screens conducted 5 months apart.  Using the sum of ranks hit selection algorithm, they found 75 and 82 hits from the first and second screens, respectively, with 43 hits overlapping.

If we take the top 75 and top 82 hits from the Shalem replicate screens, we only find 17 genes overlapping.

It’s important to note that the Shalem and Barrows assays were different, as were the screening formats: arrayed (siRNA) vs. pooled (CRISPR).  And this was one of the earliest CRISPR libraries.  Much has been learned about optimising gRNA efficiency and specificity since the Shalem screen.

However, it is also important to note that consistent inhibition of gene expression does not guarantee consistent phenotypes.  The above analysis suggests that care is needed in interpreting the results of CRISPR screens.  RNAi screens possess advantages, e.g. ease of arrayed screening, that will make them useful for many years to come.

Want to receive regular blog updates? Sign up for our siTOOLs Newsletter:

Loading


error

Like what you see? Mouse over icons to Follow / Share