Tag: RNAi screening

RNAi screening: a powerful tool for gene function discovery and therapeutic target identification.

Orthogonal design in software and RNAi screening

Orthogonal design in software and RNAi screening

The software engineering classic The Pragmatic Progammer popularised the benefits of orthogonality in software design.  They introduce the concept by describing a decidedly non-orthogonal system:

You’re on a helicopter tour of the Grand Canyon when the pilot, who made the obvious mistake of eating fish for lunch , suddenly groans and faints. Fortunately, he left you hovering 100 feet above the ground. You rationalize that the collective pitch lever [2] controls overall lift, so lowering it slightly will start a gentle descent to the ground. However, when you try it, you discover that life isn’t that simple. The helicopter’s nose drops , and you start to spiral down to the left. Suddenly you discover that you’re flying a system where every control input has secondary effects. Lower the left-hand lever and you need to add compensating backward movement to the right-hand stick and push the right pedal. But then each of these changes affects all of the other controls again. Suddenly you’re juggling an unbelievably complex system, where every change impacts all the other inputs. Your workload is phenomenal: your hands and feet are constantly moving, trying to balance all the interacting forces.

[2] Helicopters have four basic controls. The cyclic is the stick you hold in your right hand. Move it, and the helicopter moves in the corresponding direction. Your left hand holds the collective pitch lever. Pull up on this and you increase the pitch on all the blades, generating lift. At the end of the pitch lever is the throttle . Finally you have two foot pedals, which vary the amount of tail rotor thrust and so help turn the helicopter.

As the authors explain:

The basic idea of orthogonality is that things that are not related conceptually should not be related in the system. Parts of the architecture that really have nothing to do with the other, such as the database and the UI [user interface], should not need to be changed together. A change to one should not cause a change to the other.

This applies to many types of design, not just for computer systems.  The plumber should not have to depend on the electrician to fix a broken pipe.

The principle has also been used in RNAi screening, notably by Perreira et al. who introduce the MORR (Multiple Orthologous RNAi Reagent) method to increase confidence in screening hits.  Comparing the results of siRNAs from different manufacturers  is important, but because they operate by the same mechanism (including the off-target effect), they are not really orthologous.  More orthologous would be the comparison between RNAi and CRISPR experiments, which sometimes show discrepancies that point to interesting biology.

To confirm RNAi screening hits, ‘partial orthogonality’ may be preferable.  If screening hits are due to either on-target or off-target effects, confirmation with RNAi reagents that only have one or the other would be better than using CRISPR, where it is difficult to interpret the reason for discrepancies (e.g. is there no phenotype  because of genetic compensation?).

One could use C911s to create a version of the siRNA that, in theory, maintains off-target effects but eliminates on-target effects.  We have observed, however, that C911s often give substantial knockdown of the original target gene (in some ways, C911s are like very good microRNAs).  To be sure that a positive effect with C911s is not due to partial knockdown, one would also need to test that via qPCR.  C911s can create a lot of work.

Far better would be to confirm screening results with siPOOLs, which provide robust knockdown and minimal off-target effects.

One place RNAi practitioners would hope not to find orthogonality is the relationship between on-target knockdown and phenotypic strength.

Since the early days of RNAi, positive correlation between knockdown and phenotypic strength has been suggested as a means to confirms screening results.  Reagents with a better knockdown should give a stronger phenotype.

To test this, we obtained qPCR data for over 2000 siRNAs (Neumann et al.) and checked the performance of those siRNAs against the designated hit genes from an endocytosis screen (Collinet et al.).

If the siRNAs work as expected, those siRNAs with better knockdown should give stronger phenotypes than those with weaker knockdown.

There were 100 genes from the Collinet hits for which there were 3 siRNAs with qPCR data.

For those 100 siRNAs triplets, we compared the phenotypic ranks with the knockdown ranks.  (We were agnostic about the direction of phenotypic strength, and checked whether knockdown and phenotype were consistent when phenotype scores were ranked in either ascending or descending order).  For example, if siRNAs A, B, and C have phenotypic scores of 100, 90, 70 and knockdown of 15%, 20%, 30% remaining mRNA, we would say that phenotypic strength is consistent with knockdown (and because we were agnostic about phenotypic direction, we would also say it was consistent if siRNAs A, B, and C had scores of 70, 90, 100).

The observed number of cases where knockdown rank was consistent with phenotypic rank was then compared to an empirical null distribution, obtained by first randomising the knockdown data for the siRNA triplets before comparison to phenotypic strength.  This randomisation was performed 300 times.  This provides an estimate of what level of agreement between knockdown and phenotype would be expected by chance.  The standard deviation (SD) from this null distribution was then used to convert the difference between observed and expected counts into SD units.

The Collinet dataset provides data for 40 different features.  The above procedure was carried out for each of the 40 features.

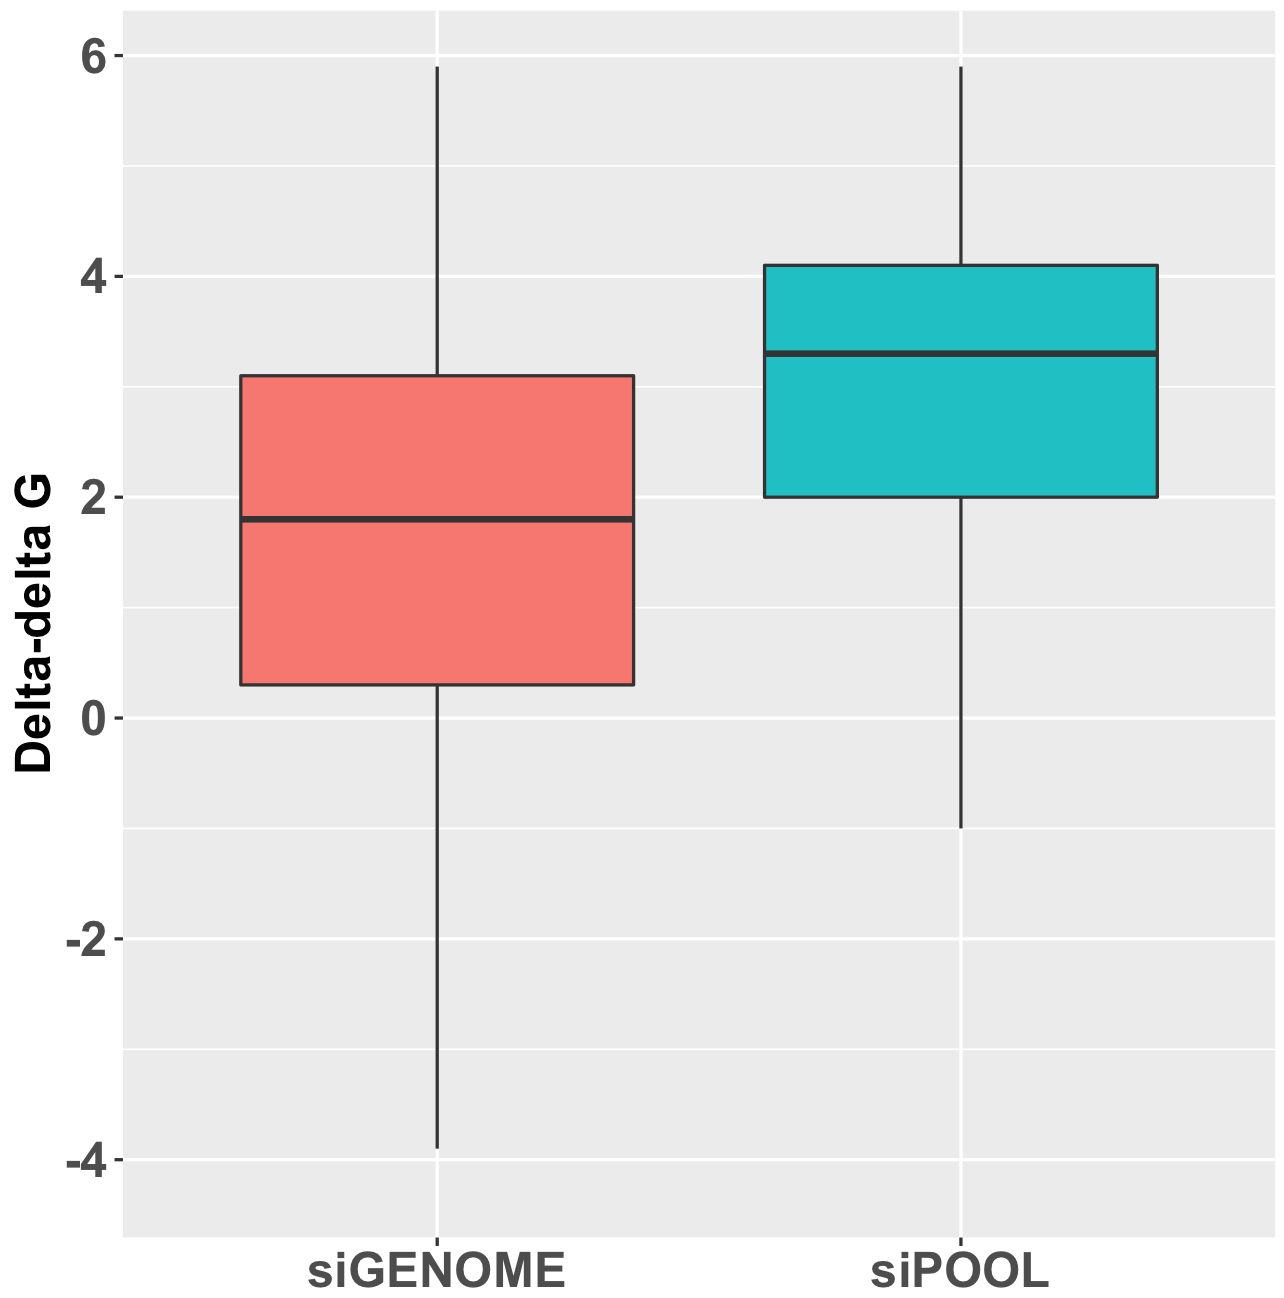
To take one feature (Number vesicles EGF) as an example, we observed 34 cases where knockdown was consistent with phenotypic strength.  By chance, we would expect 33.4 (with a standard deviation of 4.9).  The difference in SD units is (34-33.4)/4.9 = 0.1.

As can be seen in the following box plot, the number of SD units between observed and expected counts of knockdown/phenotype agreement for the 40 features is centered near zero (median is 0.1 SD units):

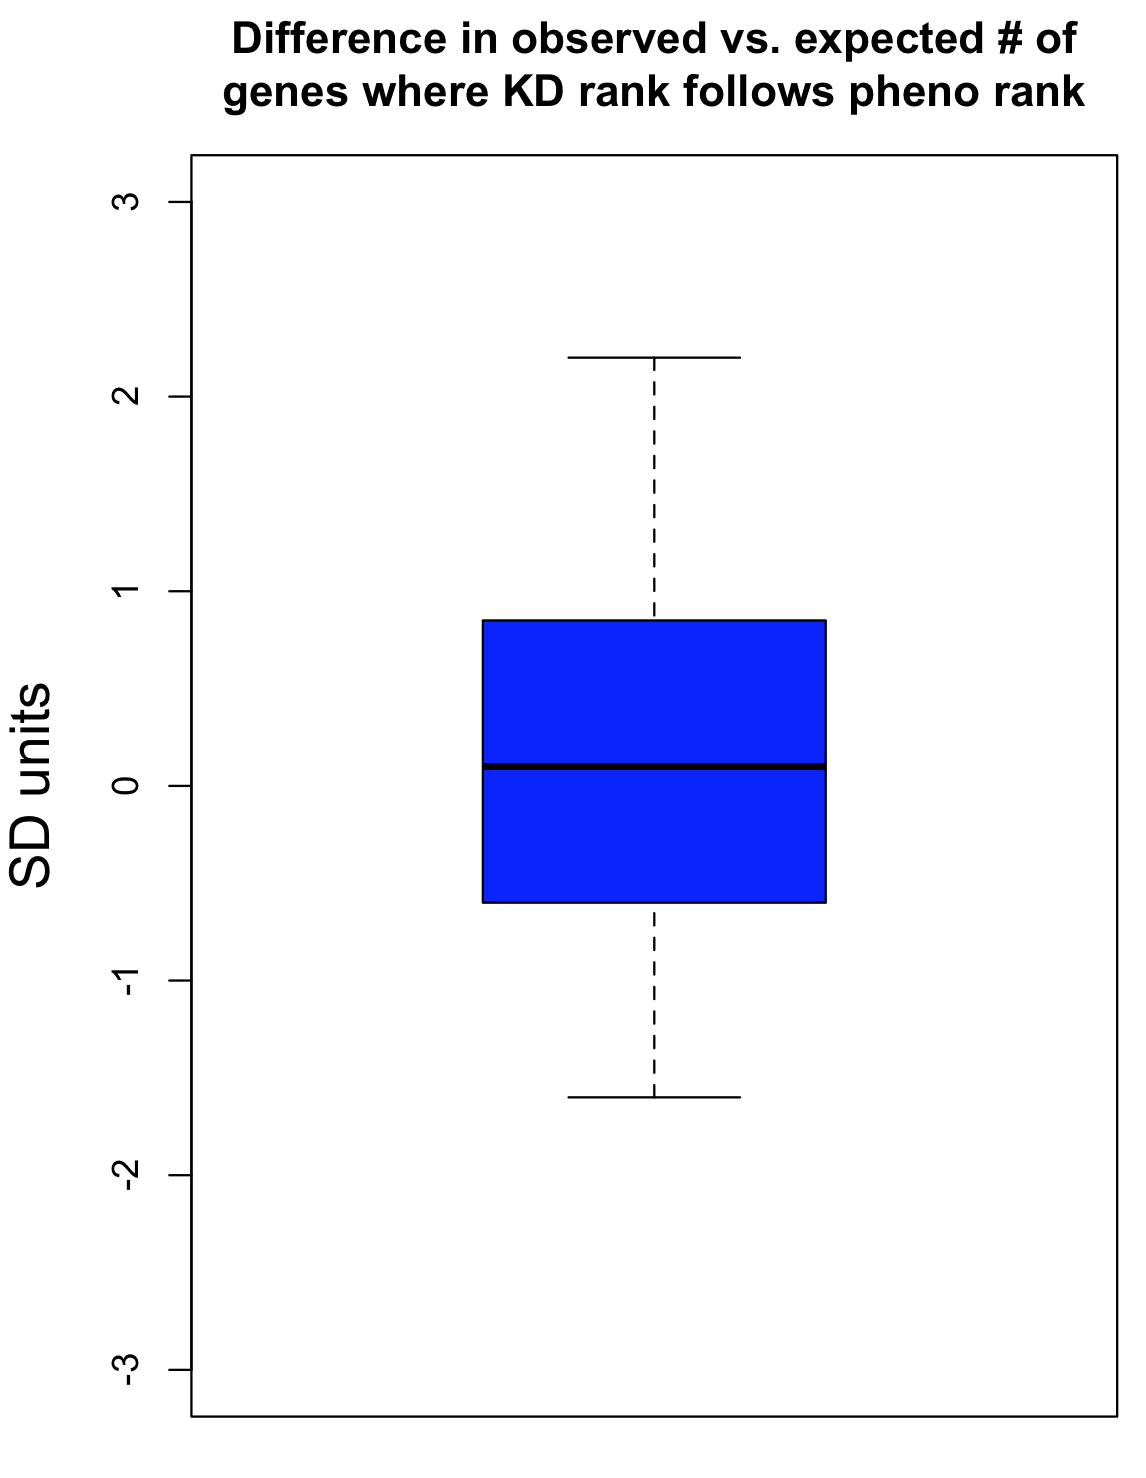
This suggests that there is very little, if any, enrichment in cases where siRNA knockdown strength is correlated with phenotypic strength.  The orthogonality between knockdown and phenotype, given the poor correlation between siRNAs with the same on-target gene, is unfortunately not unexpected.

“Phenoville” – RNAi & CRISPR Screening Strategies

“Phenoville” – RNAi & CRISPR Screening Strategies

Pleasantville is a movie based on an interesting idea: two teenagers are magically transported through their TV to a town called Pleasantville set in the 1950s where everything is perfect (and also black-and-white).  As they discover the complex, imperfect emotions hidden below the idyllic surface, the black-and-white characters and objects start to gain colour.

In loss-of-function genetic screening, some reagents and screening formats may also give rise to a narrow, black-and-white view of a biological process.  A sort of “Phenoville”.  This was illustrated nicely in a recent review of screening strategies for human-virus interactions by Perreira et al. (2016).

The authors performed screens for human rhinovirus (HRV) infection using arrayed RNAi reagents (siRNAs) and pooled CRISPR reagents (sgRNAs), and then compared the resulting hit lists.

The arrayed RNAi screen produced over 160 high-confidence candidate genes, whereas the CRISPR screen only found 2.  The authors comment:

“The comparison of these two screening approaches side-by-side, using the same cells and virus, raises an interesting point. The number of host factors found for HRV14 was far greater using the MORR/RIGER approach [i.e. RNAi performed with multiple orthologous RNAi reagents and analysed by RNAi gene enrichment ranking method] and is approaching a systems level understanding based on bioinformatic analyses and the near saturation of, or enrichment for, multiple complexes and pathways (Fig. 4) (Perreira et al., 2015). By comparison our matched pooled CRISPR/Cas9 screen for HRV-HFs yielded two high-confidence candidates based on reagent redundancy, ICAM1, the known receptor for HRV14, and EXOC4, a gene involved in exocyst targeting and vesicular transport (He & Guo, 2009). Given the known role of ICAM1 as the host receptor for most HRVs, these results point to entry as the major viral lifecycle stage interrogated by a pooled functional genomic screening approach using a population of randomly biallelic null cells infected by a cytopathic virus.”

In simple terms, RNAi screening produced a richer data set that revealed system level interactions whereas CRISPR screening yielded a small number of specific hits that only affected an early-stage pathway. The ‘systems level understanding’ is nicely shown in the following diagram of the RNAi hits.  The red box at the top left is the only gene (ICAM1) that was common to the RNAi and CRISPR screens.

Perreira et al. conclude that arrayed siRNA screens permit the detection of a larger number of viral dependency factors, albeit with a significant tradeoff in a greater number of false positive hits (mainly due to off-target effects).  In contrast, pooled screens with CRISPR sgRNAs using cell survival as a readout, as also seen with most haploid cell screens, display limited sensitivity but excellent specificity in finding host genes that act early on in viral replication (e.g. ICAM1).

In Perreira et al.‘s words:

“… given the currently available functional genomic strategies if the goal is to find viral entry factors (e.g., host receptors) with high specificity its best to use a pooled survival screen, but alternatively if the aim is to obtain with relative ease a more comprehensive set of host factors, albeit with more prevalent false positives, than an arrayed siRNA screen would be the preferred method.”

Summarizing two options for genetic screeners:

  1. Arrayed RNAi screens
    • provide a richer view of the underlying biology
    • produce more false positives from OTEs
    • produce false negatives from OTEs
  2. Pooled CRISPR screens
    • provide a narrower view of the underlying biology
    • produce fewer false positives
    • produce false negatives because of genetic compensation

Off-target effects (OTEs) are the primary cause of false positives, and the resultant higher assay noise also increases the number of false negatives in arrayed RNAi screens. Reagents like siPOOLs minimize the risk of off-target effects and reduce assay noise.

One key factor not mentioned by Perreira et al. is the presence of genetic compensation in gene knockout approaches.

Putting genetic compensation in terms of human actors, imagine that you are investigating the function of bus drivers in Pleasantville.  To induce loss-of-function, assume that aliens will be abducting the bus drivers.  If the bus drivers are abducted in their sleep (equivalent to a CRISPR knock-out), you may not get a good idea of their function when you film the next day.  People may be compensating by driving, biking or staying home.  Alternatively, the bus company may have found emergency replacement drivers.

Now suppose the bus drivers are abducted in the middle of the day while driving their routes (equivalent to an RNAi knock-down).  The film will show buses crashing (hopefully without any serious injuries, since this is just a TV show!) and the public transportation system will suddenly come to a halt.

RNAi gene knockdown screens with siPOOLs  can provide a significant advantage over CRISPR gene knockout screens in obtaining a system level understanding in biological models.

Want to receive regular blog updates? Sign up for our siTOOLs Newsletter:

Loading
siRNA vs shRNA – applications and off-targeting

siRNA vs shRNA – applications and off-targeting

Short interfering RNA (siRNA) and short hairpin RNA (shRNA) are both used in RNAi-mediated gene silencing. In this blogpost, we explore the differences in applications of siRNA and shRNA and compare their capacity for off-targeting.

For a summary of their properties, please refer to Table 1 at the end of  the post.

In what situations should we use siRNA or shRNA?

In terms of application, siRNAs are commonly applied for rapid and transient knockdown of gene expression.

It is performed in cell lines amenable to transfection by liposomes/electroporation and effects typically last from 3-7 days though retransfection can be performed to extend the effect.

The amount of siRNA introduced can be highly controlled and efficiency of gene knockdown is dependent on the levels of siRNA in the cell which is influenced by transfection efficiency and siRNA stability. Knockdown is also influenced by characteristics of the gene. A gene that is highly transcribed for example, may experience less siRNA-mediated downregulation compared to a gene where lesser copies of RNA are produced over time. In addition, a gene which expresses a protein with a very long half-life, may require extended periods of siRNA application to see a knockdown effect.

Due to the transient effect of siRNAs, shRNAs were developed to be used for prolonged knockdown of genes.

As they are introduced by viral vectors, cells that are more difficult to transfect are better targeted with shRNA. Furthermore, promoter-driven expression allows for inducible expression of the shRNA. Depending on the viral vector used – refer to Labome’s post that covers siRNA/shRNA delivery in greater detail – the shRNA may be integrated into the host genome, allowing it to be propagated into daughter cells. This maintains a consistent gene knockdown over several generations. However, knockdown efficiency can decline over time. This is mainly due to varying levels of uptake of the shRNA among cells, with a cell population having lower shRNA expression being over-represented with time.

What about RNAi screening?

siRNAs and shRNAs are both used in RNAi screening to identify genes of interest in a studied phenotype. These are performed with siRNA/shRNA libraries that target a large variety of genes. There are two RNAi screening formats commonly used – arrayed and pooled.

siRNAs and shRNAs can both be used in an arrayed screening format. This means that the siRNA(s)/shRNA(s) against each gene is tested in distinct cell populations. Arrayed screens have the advantage of being compatible with various phenotypic readouts and do not suffer from possible reagent cross-talk or challenges associated with deconvoluting data. However, they are more energy and resource-intensive to perform. (See Fig. 2)

The pooled screening format in contrast, applies only with shRNAs. Here, all shRNAs (e.g. a whole-genome shRNA library) are introduced to a single cell population. As low titers of viral vectors are used, each cell in the population is expected to take up one shRNA vector.

With pooled screening, only readouts linked to cell number can be assessed. These include measurements for cell viability or altered expression of a cell surface marker assessed by fluorescence activated-cell sorting. shRNAs targeting genes which impact these readouts are expected to skew the cell population, such that only cells affected by the relevant shRNAs can be identified. This is either through negative selection, where lost cell populations are noted, or positive selection, where cells with certain shRNAs become over-represented.

The resulting cell population is then assessed by PCR, microarray hybridization or next generation sequencing to measure which shRNAs are highly or lowly-represented. The shRNAs are identified usually by means of a DNA barcode present in the vector sequence. Of note, pooled screens take up less resources to perform but require longer assay times to allow for significant changes in the overall cell population to occur.

Fig. 2 Simplified workflow for arrayed and pooled RNAi screening formats

Off-target effects with shRNAs?

The use of siRNAs are known to produce several off-target effects but what about shRNAs? Given they are processed the same way as siRNAs, shRNAs are also subject to microRNA-like off-target effects. In addition, because they are expressed from DNA and rely on endogenous machinery to be processed into siRNA, several variations may be introduced not found with introducing siRNA directly. Some potential sources of off-target effects for shRNAs include:

1. Promoter-driven expression. shRNAs are typically controlled with a U6 promoter which drives high levels of transcription via RNA polymerase III. The high shRNA expression levels may saturate endogenous RNAi machinery, contributing to off-target effects. To counter this, shRNAs can be expressed in a context mimicking miRNAs, utilizing RNA polymerase II for transcription instead. This has been found by several groups to reduce the incidence of off-target effects (Grimm et al., 2006, Kampman et al., 2015)

2. Dicer-mediated hairpin processing. shRNAs undergo Dicer-mediated cleavage in the cytosol to remove its hairpin loop. Gu et al., 2012 reported that Dicer cleaves with sufficient heterogeneity to generate multiple sequences. This factor was reported to generate the higher noise levels unique to shRNA screens (Bhinder and Djaballah, 2013). As specificity of Dicer cleavage is influenced by neighbouring loop and bulge structures, care should be taken in shRNA design.

3. Multiple shRNA uptake. During viral transduction, the viral titer is minimized to increase the probability that cells take up a single shRNA vector. However, this does not guarantee that multiple shRNA uptake will not occur. In this event, a combinatorial gene knockdown ensues resulting in a mixed phenotype that may generate false hits.

4. Differences in genomic integration between shRNAs. Varying efficiencies in transfection and genome integration between shRNAs may skew results to over-represent certain shRNAs over others, especially in pooled screens. Furthermore, integration into the host genome may disrupt the function of certain genes, producing more off-targets.

Studies comparing results from siRNA and shRNA screens have found extremely poor overlap, both between and within the reagent-specific screens. Bhinder and Djaballah’s (2013) analysis of results from 30 published RNAi screens (16 siRNA, 14 shRNA) searching for genes that impact cell viability saw no common genes identified across the board. Furthermore, different genes were identified depending on whether the screen used siRNA or shRNA. PLK1 for example, was a prominent hit for siRNA screens but was only marginally represented in shRNA screens. In contrast, KRAS was a top hit among shRNA screens.

Fig. 3 Reagent format of RNAi screens analysed in Bhinder and Djaballah, 2013 Screens were performed either with genome-wide (GW) or focused (FD) siRNA/shRNA libraries. For siRNA screens, Pooled refers to pools of 3 siRNAs applied together compared to Singles where a single siRNA duplex was applied. For shRNA screens, Pooled refers to a pooled format screen (Fig. 2) where ~50, 000 shRNAs were applied to a single cell population. Arrayed refers to arrayed format screen where shRNAs were applied individually (Fig. 2).

Fig. 4 Overlap of hits among genome-wide (left) and focused (right) siRNA screens (Bhinder and Djaballah, 2013) Only 4 common hits detected across the 2 lethal gene lists from genome-wide siRNA screens. In focused siRNA screens, a greater overlap was detected but still limited across the 22 lethal gene lists. PLK1 detected in 9 out of 22 gene lists.

Fig. 5 Overlap of hits among genome-wide (left) and focused (right) shRNA screens (Bhinder and Djaballah, 2013) KRAS was a top hit in shRNA GW screens, appearing in 5 out of 9 lists. In focused shRNA screens, KRAS was present in 15 out of 31 lists. 

Worryingly, an enrichment of gene candidates exclusive to pooled shRNA screens was observed as opposed to arrayed shRNA or siRNA screens. Most of the overlap seen in gene lists (80% global overlaps, 60% after stringent filtering) were specific to pooled shRNA screens. Exclusion of data from pooled shRNA screens would have reduced overlap to a mere 27%. This indicates gene targets obtained from shRNA pooled screens is specific to the technique as opposed to specific gene downregulation.

Furthermore, a greater number of hits were obtained from shRNA screens – 6664 candidates from 40 shRNA gene lists – as opposed to 1525 candidates from 24 siRNA gene lists. This indicates a generally noisier dataset associated with shRNA screens.

Bhinder and Djaballah later performed a head-to-head comparison of an arrayed siRNA and shRNA screen and reported similarly dismal results. Despite using a gain-of-function assay, which tends to yield clearer results, only a 29 hit overlap was seen between siRNA and shRNA libraries which shared 15,068 common genes. Based on a known set of positive controls, siRNAs identified 8 known regulators as opposed to shRNA which only identified 3. Furthermore, predicted siRNA sequences obtained after Dicer-processing of shRNA which corresponded to exactly the same siRNA sequence from the siRNA library yielded different phenotypes. The authors highlight that differential intracellular processing of the shRNA contributes significantly to the discrepancies observed.

It is evident that shRNAs are at risk to greater number of off-target effects than siRNAs. Much care should be taken towards the interpretation of pooled shRNA screens in particular. Secondary validation of gene hits plays an increasingly important role. It is recommended to validate gene hits with siPOOLs (high-complexity, defined siRNA pools) which have a lower off-target profile than single siRNAs or low complexity siRNA pools of 3-4. siPOOL-resistant rescue constructs enable further affirmation that the loss-of-function phenotype is attributed to the target gene. Alternative tools such as compounds, antibodies or gene knockout technologies are also highly recommended.

Want to receive regular blog updates? Sign up for our siTOOLs Newsletter:

Loading

Table. 1 Comparison of properties between siRNA and shRNA

siRNA shRNA
Structure 20-25 nucleotide long double-stranded RNA (dsRNA) with 2 nucleotide overhangs at the 3’ end

~57-58 nucleotide long RNA sequence with a dsRNA region linked by non-pairing nucleotides to form a stem-loop structure

Delivery RNA itself with liposome/electroporation-mediated delivery into cells Usually delivered to cells via viral vectors. DNA may be incorporated into host genome depending on viral vector used.
Processing In the cytosol, guide or antisense strand* (shown in blue in Fig. 1) is incorporated into RNA induced silencing complex (RISC). RISC is guided towards RNA transcripts with the complementary sequence to mediate cleavage and subsequent degradation of the transcript.

*Note that the sense strand may also load into RISC and mediate off-targeting but incidence of this is reduced by designing siRNA with  appropriate thermodynamic properties (refer to previous blogpost on siRNA design)

In the nucleus, shRNA is transcribed from DNA by either RNA polymerase I or III, depending on the promoter.

Drosha, a member of the ribonuclease III family, processes the RNA transcript of its long flanking single-stranded RNA sequences and the resultant shRNA is exported out of the nucleus by Exportin-5.

In the cytosol, the enzyme Dicer cuts off the hairpin loop of the shRNA and releases the functional active siRNA which follows the same downstream processing as siRNAs.

Length of expression Varies from 3-7 days. Affected by degradation of siRNA within cell and dilution of effect upon cell division. Expression can be reinstated by re-transfecting the siRNA. If the DNA is stably integrated in the host genome, knock-down is theoretically permanent.
Control of knockdown Easily controlled by varying amount of siRNA introduced. Magnitude of knockdown harder to control as determined by promoter-driven efficiency and shRNA vector uptake. Expression however can be made inducible with Tet-on/off systems.
Making sense of siGENOME deconvolution

Making sense of siGENOME deconvolution

As discussed previously, deconvoluted Dharmacon siGENOME pools often give surprising results.  (Deconvolution is the process of testing the 4 siRNAs in a pool individually.  This is usually done in the validation phase of siRNA screens.)

One way to compare the relative contribution of target gene and off-target effects is to calculate the correlation between reagents having the same target gene or the same seed sequence.  One of the first things we do when analysing single siRNA screens is to calculate a robust form of the intraclass correlation (rICC, see discussion at bottom for more about this).

Recently we were analysing deconvolution data from Adamson et al. (2012) and calculated the following rICC’s.  (The phenotype measured was relative homologous recombination.)

Grouping variable  rICC    95% confidence interval

Target gene        0.040   -0.021-0.099
Antisense 7mer     0.383   0.357-0.413
Sense 7mer         0.093   0.054-0.129

Besides the order of magnitude difference between target gene and antisense seed correlation (which is commonly observed in RNAi screens), what stands out is the ~2-fold difference between the correlation by target gene and sense seed.

Very little of the the sense strand should be loaded into RISC, if the siRNAs were designed with appropriate thermodynamic considerations (the 5′ antisense end should be less stable than the 5′ sense end, to ensure that the antisense strand is preferentially loaded into RISC).

The above correlations suggest that some not insubstantial amount of sense strand is making it into the RISC complex.

Here is the distribution of delta-delta-G for siPOOLs and siGENOME siRNAs targeting the same 500 human kinases (see bottom of post for discussion of calculation).  A positive delta-delta G means that the sense end is more thermodynamically stable than the antisense end, favouring the loading of the antisense strand into RISC.

This discrepancy in delta-delta G is also consistent with comparison of mRNA knockdown:

The siGENOME knockdown data comes from 774 genes analysed by qPCR in Simpson et al. (2008).  The siPOOL knockdown data is from 223 genes where we have done qPCR validation.

Of note, the siGENOME pools were tested at 100 nM, whereas siPOOLs were tested at 1 nM.

(It should be mentioned that, although consistent with the observed differences in ddG, this is only an indirect comparison, and delta-delta G is not the only determinant of functional siRNAs.)

Notes on intraclass correlation

Intraclass correlation measures the agreement between multiple measurements (in this case, multiple siRNAs with the same target gene, or multiple siRNAs with the same seed sequence).   One could also pair off all the repeated measures and calculate correlation using standard methods (parametrically using Pearson’s method, or non-parametrically using Spearman’s method).  The main problem with such an approach is that there is no natural way to determine which measure goes in the x or y column.  Correlations are normally between different variables (e.g. height and weight).  In a case of repeated measures, there is no natural order, so the intraclass correlation (ICC) is the more correct way to measure the similarity of within-group measurements.  As ICC depends on a normal distribution, datasets must first be examined, and if necessary, transformed beforehand.

Robust methods have the advantage of permitting the use of untransformed data, which is especially useful when running scripts across hundreds of screening dataset features.  The algorithm we use calculates a robust approximation of the ICC by combining resampling and non-parametric correlation.

Here is the algorithm, in a nutshell:

  1. Group observations (e.g. cell count) by the grouping variable (e.g. target gene or antisense seed)
  2. Randomly assign one value of each group to the x or y column (groups with one 1 observation are skipped)
    • for example, if the grouping variable is target gene and siRNAs targeting PLK1 had the values 23, 30, 37, 45, the program would randomly choose 1 of the values for the x column and another for the y column
  3. Calcule Spearman’s rho (non-parametric measure of correlation)
  4. Repeat steps 1-3 a set number of times (e.g. 300) and store the calculated rho’s
  5. Calculate mean of the rho values from 4.  This is the robust approximation of the ICC (rICC).
    • Values from 4 are also used to calculate confidence intervals.

The program that calculates this is available upon request.

Notes on calculating delta-delta G

Delta-delta G was calculated using the Vienna RNA package, as detailed here: https://www.biostars.org/p/58979/ (in answer by Brad Chapman).

The delta-delta G was calculated using 3 terminal bps.  We found that that ddG of the terminal 3 bps had the strongest correlation with observed knockdown.  Others (e.g. Schwarz et al., 2003 and Khvorova et al., 2003) have also used the terminal 4 bps.

Want to receive regular blog updates? Sign up for our siTOOLs Newsletter:

Loading
The final RNAiL?

The final RNAiL?

A recent article in The Scientist asks whether, in light of a paper by Lin et al. showing phenotypic discrepancies between RNAi and CRISPR, this is not ‘the last nail in the coffin for RNAi as a screening tool’?

The paper in question found that a gene (MELK) that had been shown by many RNAi-based studies to be critical for several cancer types shows no effect when knocked out via CRISPR.  They also report that in relevant published genome-wide screens, MELK was not at the top of the hit lists.

Does this mean that the papers that used RNAi were unlucky and off-target effects were responsible for their observed phenotypes?

Gray et al. identified MELK as a gene of interest based on microarray experiments.  They then designed RNAi experiments to test its role in proliferation.  Assuming that this study and the subsequent ones followed good RNAi experimental design (using reagents with varying seed sequences, testing the correlation between gene knockdown and phenotypic strength, etc.), we can be fairly confident that MELK is involved in proliferation.  It might not be the most essential player, which would explain why it is not at the top of screening hit lists.  And screening lists have the draw-back of enriching for off-target hits.

Another possibility is that Lin et al. have observed a known complicating feature of knock-out screens: genetic compensation.  Although they undertake experiments to address this issue, it could be that compensation takes place too quickly for their experiments to rule it out.  Furthermore, they could have addressed this issue by testing knock-down reagents themselves, and checking whether genes they hypothesise as responsible for the supposed off-target effect in the published RNAi work are in fact down-regulated.  C911 reagents could also be used to test for off-target effects.  This is extra work, but given that they are disputing the results in many published studies, this seems justified.

As regards the role of RNAi in screening, The Scientist concludes with the following (suggesting that their answer to the question of whether this is the final nail is also No):

In the meantime, one obvious solution to the problem of target identification and validation is to use both CRISPR and RNAi to validate a target before it moves into clinical research, rather than relying on a single method. “We have CRISPR and short hairpin reagents for every gene in the human genome,” said Bernards. “So when we see a phenotype with CRISPR, we validate with short hairpin, and the other way around. I think that would be ideal.”

Although we agree that validating CRISPR hits with RNAi reagents is important (especially if drugability is a concern), one has to be careful with RNAi reagents, like single siRNAs/shRNAs or low-complexity pools, that are susceptible to seed-based off-target effects.  For validating CRISPR screening hits, siPOOLs provide the best protection against unwanted off-target effects, saving you time, money, and disappointment during the validation phase.


Want to receive regular blog updates? Sign up for our siTOOLs Newsletter:

Loading
Where’s the beef?

Where’s the beef?

In our last blog entry, we discussed a classic RNAi screening paper from 2005 that showed that the top 3 screening hits were were due to off-target effects.

In this post, we analyse a more recent genome-wide RNAi screen by Hasson et al., looking in more detail at what proportion of top screening hits are due to on- vs. off-target effects.

Hasson et al. used the Silencer Select library, a second-generation siRNA library designed to optimise on-target knock down, and chemically modified to reduce off-target effects.  Each gene is covered by 3 different siRNAs.

To begin the analysis, we ranked the screened siRNAs in descending order of % Parkin translocation, the study’s main readout.

We then performed a hypergeometric test on all genes covered by the ranked siRNAs.  For example, if gene A has three siRNAs that rank 30, 44, and 60, we calculate a p-value for the likelihood of having siRNAs that rank that highly (more details provided at bottom of this post).  It’s the underlying principle of the RSA algorithm, widely used in RNAi screening hit selection.  If the 3 siRNAs for gene B have a ranking of 25, 1000, and 1500, the p-value will be higher (worse) than for gene A.

The same type of hypergeometric testing was done for the siRNA seeds in the ranked list.  For example, if the seed ATCGAA was found in siRNAs having ranks of 11, 300, 4000, and 6000, we would calculate the p-value for those rankings.  Seeds are over-represented in siRNAs at the top of the ranked list will have lower p-values.

After doing these hypergeometric tests, we had a gene p-value and a seed p-value for each row in the ranked list.  We could then look at each row in the ranked list estimate whether the phenotypic is due to an on- or off-target effect by comparing the gene and seed p-values.  [As a cutoff, we said that the effect is due to one of either gene or seed if the difference in p-value is at least two orders of magnitude.  If the difference is less than this, the cause was considered ambiguous.]

After assigning the effect as gene/seed/ambiguous, we then calculated the cumulative percent of hits by effect at each position in the ranked list.   Those fractions were then plotted as a stacked area chart (here, looking at the top 200 siRNAs from the screen):


The on-target effect is sandwiched between the massive ‘bun’ of off-target effects and ambiguous cause.  We are reminded of these classic commercials from the 80s:


Want to receive regular blog updates? Sign up for our siTOOLs Newsletter:

Loading


Note on p-value calculations:

P-values were calculated using the cumulative hyper-geometric test (tests the probability of finding that many or more instances of members belonging to the particular group, in our case a particular gene or seed sequence).  The p-value associated with a gene or seed is the best p-value for all the performed tests.  For example, assume a gene had siRNAs with the following ranks: 5, 20, 1000.  The first test calculates the p-value for finding 1 (of the 3) siRNAs when taking a sample of 5 siRNAs.  The next test calculates the p-value for finding 2 (of 3) siRNAs when taking a sample of 20 siRNAs.  And the last is the probability of getting 3 (of 3) siRNAs when taking a sample of 1000.  If the best p-value came from the second test (2 of 3 siRNAs found in a sample size of 20), that is the p-value that the gene receives.  This is also the approach used by the RSA (redundant siRNA activity) algorithm.  One advantage of RSA is that it can compensate for variable knock down efficiency of the siRNAs covering a gene (e.g. if 1 of 3 gives little knockdown).

Classic Papers Series: Lin et al. show RNAi screen dominated by seed effects

Classic Papers Series: Lin et al. show RNAi screen dominated by seed effects

Over the coming months, we will highlight a number of seminal papers in the RNAi field.

The first such paper is from 2005 by Lin et al. of Abbott Laboratories, who showed that the top hits from their RNAi screen were due to seed-based off-target effects, rather than the intended (and at that time, rather expected) on-target effect.

The authors screened 507 human kinases with 1 siRNA per gene, using a HIF-1 reporter assay to identify genes regulating hypoxia-induced HIF-1 response.

In the validation phase of their screen, they tested new siRNAs for hit genes, but found that they failed to reproduce the observed effect, even when using siRNAs that had a better on-target knock down than the pass 1 siRNAs.

Figure 1A.  Left panel shows on-target knock down of pass 1 siRNA for GRK4 (O) and the new design (N).  Centre panel shows Western blot of protein  levels  Right panel shows HIF-1 reporter activity for positive control (HIF1A) and the original (O) and new (N) siRNAs.

The on-target knock down is much-improved for the new design, yet its reporter activity is indistinguishable from negative control.  Yet the pass 1 siRNA with poor knock down gives almost as strong a result as HIF1A (positive control).

By qPCR, they then showed that GRK4(O) and another one of the top 3 siRNAs silence HIF1A (the positive control gene).  Using a number of different target constructs they also nicely show that it was due to seed-based targeting in the 3′ UTR.

Although the authors screened at a high initial concentration (100 nM), the observed off-targets persisted at 5 nM, suggesting that just screening at lower concentrations would not have improved their results.

The authors conclude:

In addition, due to the large percentage of the off- target hits generated in the screening, using a redundant library without pooling in the primary screen could significantly reduce the efforts required to eliminate off-target false positives and therefore, will be a more efficient design than using a pooled library.

This is true for low-complexity pools, but high-complexity pools can overcome this problem by providing a single reliable result for each screened gene.

Want to receive regular blog updates? Sign up for our siTOOLs Newsletter:

Loading
The nasty, ugly fact of off-target effects

The nasty, ugly fact of off-target effects

Once upon a time, it was imagined that siRNAs specifically knock down the intended target gene.

Unfortunately, this turned out to be wrong.

The disappointing results from siRNA screening following the initial high hopes brings to mind T.H. Huxley‘s famous quote about a beautiful theory being killed by an ugly, nasty little fact.

As pointed out by S.J. Gould in Eight Little Pigs, the origin of the quote is given in the autobiography of Sir Francis Galton.

Galton’s autobiography is inspirational.  As one reviewer put it, “there is a feeling of calmness and awe that comes from knowing that a person of his genius, wisdom and versatility actually existed.”  He was 70, and had already made significant contributions to genetics, statistics, meteorology, and geography, when he published his first major work on fingerprints, which would become the basis for modern forensic fingerprint analysis.

His work on fingerprints also provides the context for the famous Huxley quote:

Much has been written, but the last word has not 
been said, on the rationale of these curious papillary 
ridges ; why in one man and in one finger they form 
whorls and in another loops. I may mention a 
characteristic anecdote of Herbert Spencer in con- 
nection with this. He asked me to show him my 
Laboratory and to take his prints, which I did. Then 
I spoke of the failure to discover the origin of these 
patterns, and how the fingers of unborn children had 
been dissected to ascertain their earliest stages, and so 
forth. Spencer remarked that this was beginning in 
the wrong way ; that I ought to consider the purpose 
the ridges had to fulfil, and to work backwards. 
Here, he said, it was obvious that the delicate mouths 
of the sudorific glands required the protection given 
to them by the ridges on either side of them, and 
therefrom he elaborated a consistent and ingenious 
hypothesis at great length. 

I replied that his arguments were beautiful and 
deserved to be true, but it happened that the mouths 
of the ducts did not run in the valleys between the crests, 
but along the crests of the ridges themselves. He 
burst into a good-humoured and uproarious laugh, and 
told me the famous story which I have heard from 
each of the other two who were present on the 
occurrence. Huxley was one of them. Spencer, 
during a pause in conversation at dinner at the 
Athenaeum, said, "You would little think it, but I 
once wrote a tragedy." Huxley answered promptly, 
" I know the catastrophe." Spencer declared it was 
impossible, for he had never spoken about it before 
then. Huxley insisted. Spencer asked what it was. 
Huxley replied, "A beautiful theory, killed by a 
nasty, ugly little fact."  

Memories of My Life, pp 257-258
Don’t swallow the fly

Don’t swallow the fly

There was a PI who screened one s i [RNA],

Oh, I don’t know why they screened one s i …

siRNA screens have a high false positive rate, due to pervasive off-target effects.

Confirming ‘hits’ from single-siRNA screens is a lot of work.  For low-complexity pool screens, it’s even worse (and, as we will discuss in a later post, less likely to result in true genes of interest).

Progressively, one accumulates a nearly indigestible set of experiments and analyses.

On the in vitro side:

  • Screen additional siRNAs for ‘hit’ genes.
  • Do quantitative PCR.  Single siRNAs vary significantly in their effectiveness, so look for correlation between knock-down and phenotypic strength.
  • Create C911 versions of hit siRNAs as off-target controls.  To rule out a confounding on-target effect, do qPCR.
  • Screen additional siRNAs with the same seed sequence as off-target controls (as done in a recent paper).
  • For low-complexity pools, test the siRNAs individually.

On the in silico side:

  • For each hit siRNA, look at plots of phenotypic effects of siRNAs with same seed sequence.
  • Adjust phenotypic scores based on predicted off-target effects for seeds.
  • Run off-target hit selection tools (like Haystack or GESS), to see if hit genes also show up as strong off-targets.

Does it really have to be so complicated?

Wouldn’t you prefer being able to trust your phenotypic readout?

Better yet, how about hits that don’t turn out to be mostly false-positives?

There is a simpler, better way.

siPools maximize the separation between on-target signal and off-target noise, making interpretation of RNAi phenotypes as clear as possible.

Celebrating 11 years of off-target effects

Celebrating 11 years of off-target effects

OT_bday_cake


This year marks the 11th anniversary of Jackson et al.‘s seminal paper on siRNA off-target effects.

The past decade of high-throughput siRNA screening is largely a deductive footnote to their observation that “…the vast majority of the transcript expression patterns were siRNA-specific rather than target-specific“.

  • 2005, Lin et al. show that top hits from RNAi screen are due to off-target effects
  • 2009, Bushman et al. report poor overlap between hits from HIV host factor screens
  • 2012, Marine et al. show that correlation between siRNAs for same gene is near zero, while seed sequences (involved in off-target effects) account for ~50 times more screening variance

marine_cors

  • 2013, Hasson et al. find little overlap between hits from a mitophagy assay run in parallel with different siRNA libraries

Wouldn’t it have been a minor miracle if the phenotype from the following transcriptional profile were due to  knockdown of the intended gene? (intended gene: Scyl1, gene actually responsible for phenotype: Mad2L1, source)

sirna_MA

We are not saying that siRNA screens are not useful.  There is some signal amongst the off-target noise.  But luck and a lot of work are required.  Among the top genes from the resulting ‘hit’ list, one must hope that a story can be made (TOMM7, a major character in the Hasson paper, was relatively far down the hit list, and its known location in the mitochondrial outer membrane made it more than a lucky guess).

But there is a better way.  By maximising the separation between on-target signal and off-target noise, siPools can provide clearer phenotypes, thereby reducing wasted effort and dependance on luck.

siPool_MA


Notes:

Birthday cake created using Fig 2b from Jackson et al. (heat map showing deregulation of off-target transcripts by siRNAs against IGF1R).

Calculation of variance explained by genes vs. seeds (from Marine et al.):

by-gene R = .073; by-seed R = .53; .53 ^ 2 / .073 ^ 2 = 52.71


error

Like what you see? Mouse over icons to Follow / Share